
European Helio- and Asteroseismology Network (HELAS)
Local Helioseismology Network Activity
|
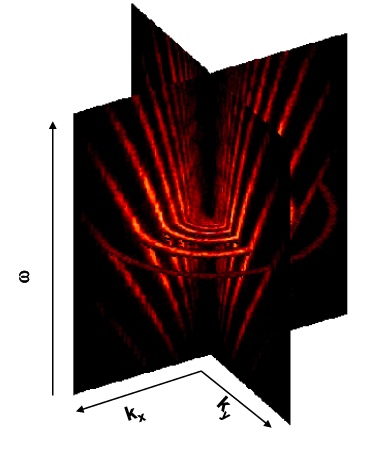
Ring Diagram PipelineRing-diagram analysis is named in this way because it uses the rings of power observed at constant frequency (as in the figure below). Changes in shape, orientation and width of the rings indicates the presence of flows and other subsurface anomalies. It is mostly used to infer the speed and direction of horizontal flows below the solar surface by observing the Doppler shifts of the solar acoustic waves and analysing the power spectra. The ring diagram method is based on the computation and fitting of local power spectra and was first introduced by Hill (1988, Ap. J., 333, 996). Thus ring analysis is a generalization of global helioseismology applied to local areas, typically 15 degrees squared, on the Sun.
Download: GONG Ring Analysis pipeline: a tar file with README file explaining installation. Please contact schunker [at] mps.mpg.de for appropriate acknowledgements if you use this, or the result from this, pipeline. NB: the configure file in this pipeline had to by slightly modified to run at the MPS. We have 64-bit machines and some library links were missing. Here are two (configure and elist/ephem.c) slightly modified codes to run the MPS version. Documentation: The GONG Ring Pipeline Documentation webpage. Tracking and remapping steps (ps). Inversion steps for pipeline (pdf). GONG++ Ring Diagram Pipeline (presentation, 2003). Presentation given at the HELAS Workshop in Nice, 2006
This website is best viewed using Firefox, Safari or Internet Explorer browsers.
|


