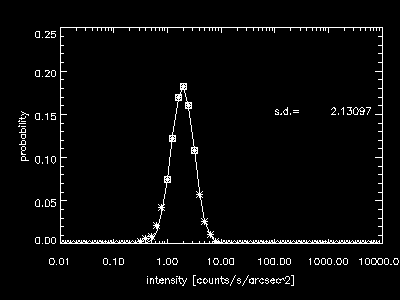
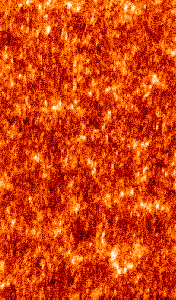
 Cont.1404 [6 000 K]
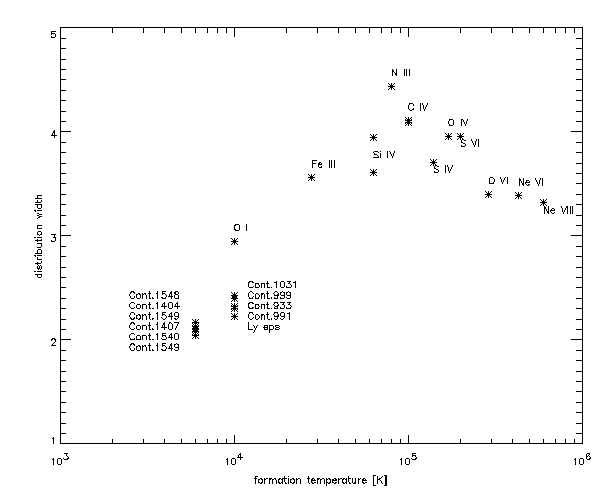
As a concluding graph, temperature vs. lognormal width is given for this and a few other studies' preliminary results. It appears that transition region lines around 80 000 - 100 000 K produce the widest variety of intensities.

 Cont.1404 [6 000 K]
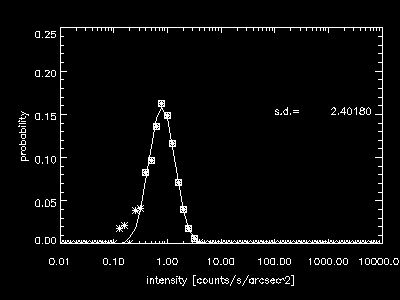
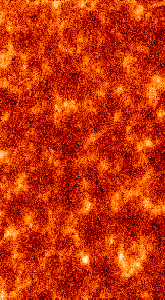 Cont.999 [10 000 K]
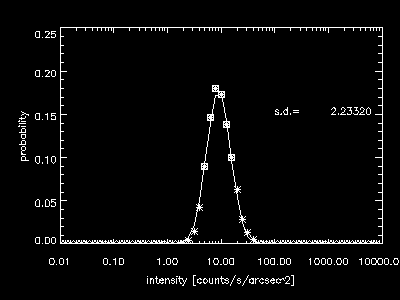
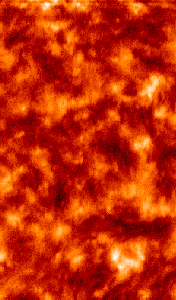 Ly eps [10 000 K]
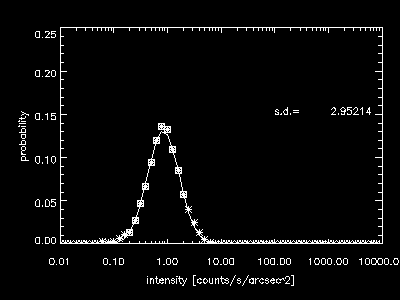
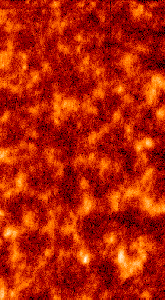 O I [10 000 K]
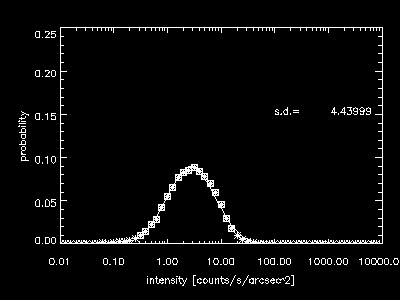
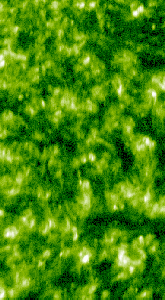 N III [80 000 K]
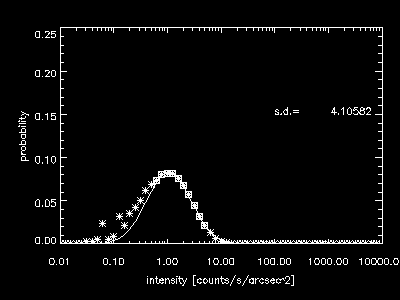
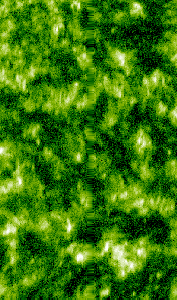 C IV [100 000 K]
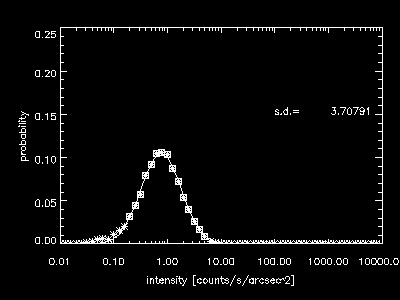
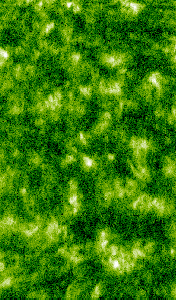 S IV [140 000 K]
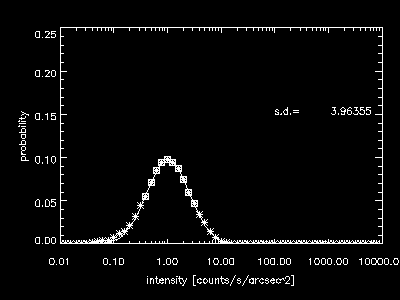
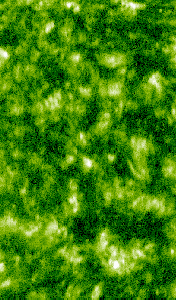 O IV [170 000 K]
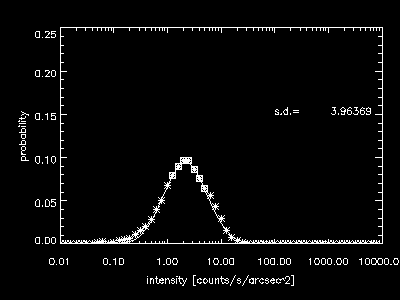
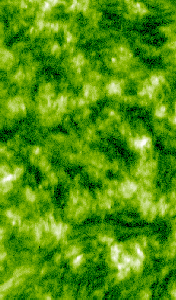 S VI [200 000 K]
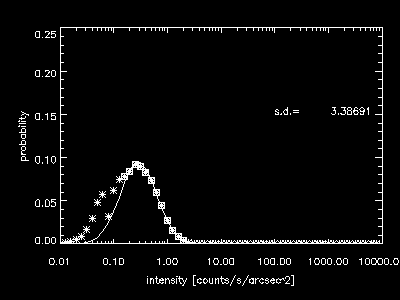
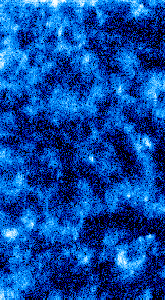 Ne VI [430 000 K]
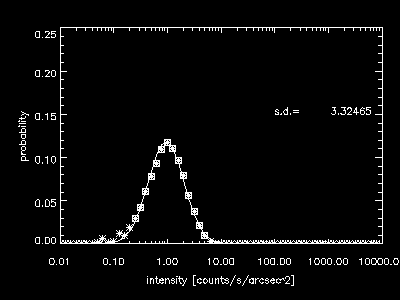
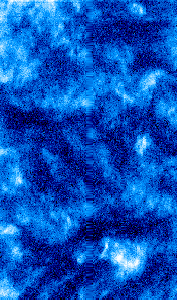 Ne VIII [600 000 K]
 Conclusion
IED, 01.Oct.97