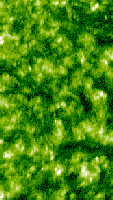
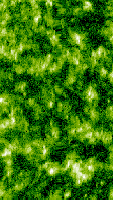
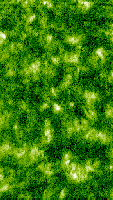
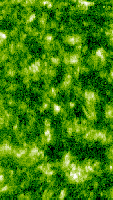
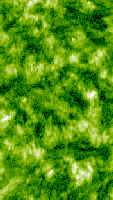
 N III, C IV, S IV, O IV, S VI
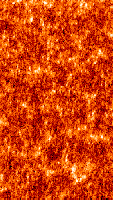
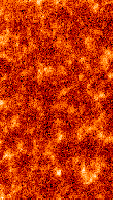
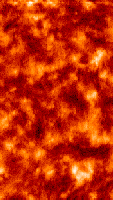
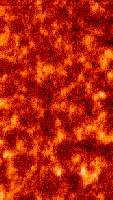 Cont.1404, Cont.999, Ly eps, O I


 N III, C IV, S IV, O IV, S VI
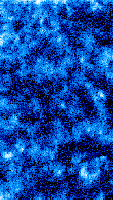
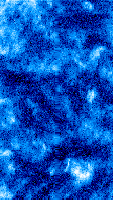 Ne VI, Ne VIII
The images above show a region of the Solar network situated between 68 and 368 arcsec N and between 291 and 116 arcsec E of the Solar center on 04.Jul.96 at 02:00 UT. To locate it, please refer to an EIT image taken 4 hours earlier.
This region was followed and scanned four times in alternating directions using eight different spectral windows:
02:00-03:00 UT   E->W   S VI 933, Ly eps 937
03:00-04:00 UT   W->E   N III 991, Ne VI / O I 999
04:00-05:00 UT   E->W   S IV 1404, O IV 1407
05:00-06:00 UT   W->E   Ne VIII 770, C IV 1548
Within 02.-06.Jul.96, SUMER was following this network region from the eastern to the western Solar hemisphere, repeating more than 20 times the sequence described above. It was part of "JOP022: Network Evolution and Dynamics" (cf. SOHO campaign 121). For each scan, 230 raster steps were performed; the step size was 0.76 arcsec (oversampling), with an exposure time of 14.75 seconds per step.
The study was initiated by Philippe Lemaire, IAS.
The results of 04.Jul.96 can also be used to study the distribution of intensities at different temperature levels. (under construction)
Detailed information can be viewed for individual lines. This includes 2D images of background and line intensities, relative line shifts and broadenings. Also, the average spectral window is shown together with the average profile, with pixels considered line (*) and continuum (+) marked. (under construction)
IED, 01.Oct.97