SUMER study #646: Scans in Si I, O V
- date, time: 29.Aug.96, 00:03 - 00:17 UT, 02:47 - 03:01 UT
- field of view: 60 (35) arcsec E - 60 (85) arcsec W,
60 arcsec S - 60 arcsec N
- slit: 1.0 arcsec x 120 arcsec, centered (number 4)
- raster step size: 0.75 arcsec (2 elementary steps)
- exposure time: 5 seconds
- telemetry: 2(scans) * 2(windows) * 160 images of 25 spectral x 120 spatial
pixels (format 14)
- compression: quasilog-min-max (method 5)
- wavelengths: 629.732 Å on reference pixel 582 of Detector A
1256.50 Å on reference pixel 650 of Detector A
- rotation compensation: 0.75 arcsec after 286.304 seconds
- binning: 2 pixels spectral, no spatial
- on-board flat field correction: no
Remarks: The scans were taken before and after a multi-wavelength
study on chromospheric oscillations, where the slit was positioned in the
centre of the field of view for 2.5 h. - The study was initiated by T. Kucera
and T. Moran (NASA/GSFC).
Spectral window
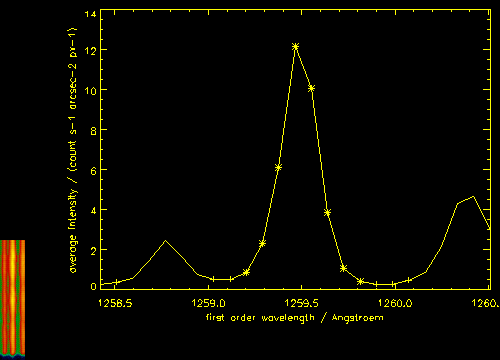
Average detector image, average profile.
O V 629.7 (230 000 K)

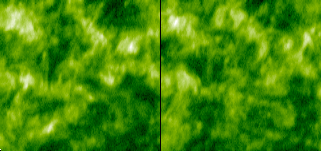

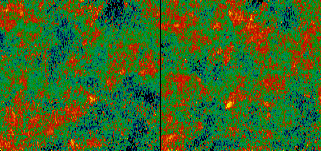
Continuum and line intensity; line shift and width.
Spectral window
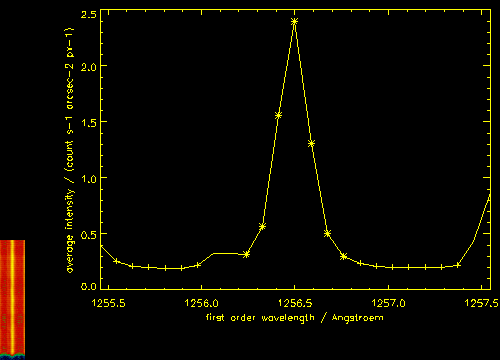
Average detector image, average profile.
Si I 1256.5 (10 000 K)

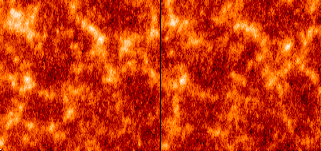

Continuum and line intensity; line shift and width.
IED, 17.Aug.01


