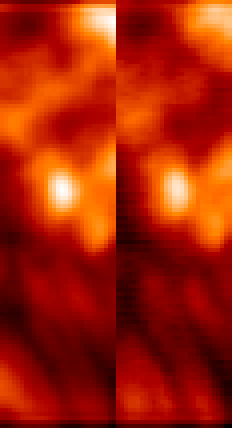
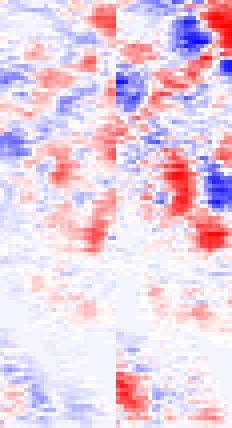
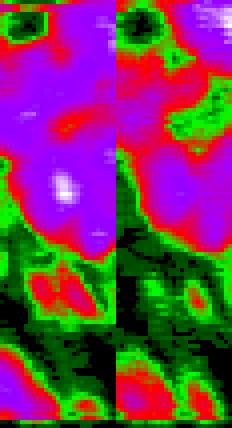
SUMER performed 112 consecutive scans in alternating directions within a region in the Solar south-east containing a bright point. The bright point was selected and targeted in real time using an EIT image in Fe IX/X (171 Å). The images shown above cover part of a region -145 to -112 arcsec east and -121 to -15 arcsec south of the Solar center at 13:22 UT. During the following 3:40 hours, SUMER's on-board rotation compensation kept track of this structure.
Each scan consisted of 11 raster steps of approx. 3 arsec with an exposure time of 10 seconds each, leading to approx. 2 minutes per scan. The scans were taken simultaneously in the emission lines of Lyman epsilon at 937 Å (chromosphere, temperature 10 000 K) and Sulfur VI at 944 Å (transition region, temperature 200 000 K). The spectral windows were approx. 1 Å around the commanded wavelengths.
The images above demonstrate the constant features of this bright point region within the whole scanning time, since they are averaged along the temporal dimension. They show line intensity, line shift and line broadening for Ly eps (left half) and S VI (right half).
The temporal evoluton of this bright point's structure can be observed in an animation. (108 of the 112 images could be retrieved from FITS files.) Please load the IDL/XDR restore file BP_MOVIE_XDR.RST (680 KB) and the IDL routine BP30AUG96.PRO, and start the animation with IDL> .run bp30aug96
A first report can be found in: Bocchialini, K., J.-C. Vial, G. Einaudi, "Statistical Analysis of a Bright Point Observed Simultaneously in two Chromospheric and Transition Region Lines by SUMER", ESA SP-404 (Proc. of 5th SOHO Workshop, Oslo, 17-20 June 1997), 211-215, 1997
IED, 03.Sep.97