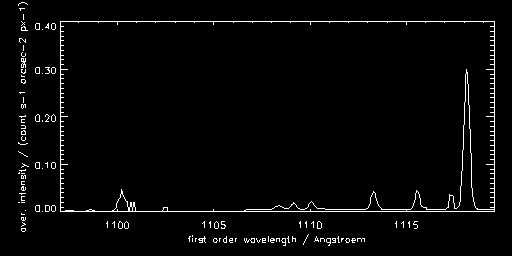
The sequence W,R,L,R,L,R,L,R,L,R,L is repeated 46 times, where W refers to the whole spectral window (1098-1138 Å, format 2), while L and R refer to the left and right part of this window - with a small overlap containing the Ca X 1115/2 and the Fe XIX 1118 line - which are repeated five times, alternating (both in format 38).
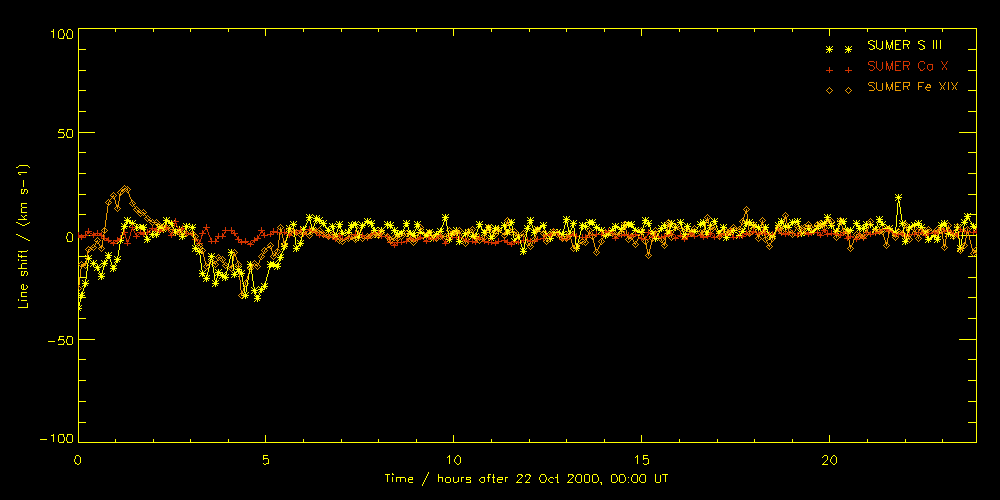
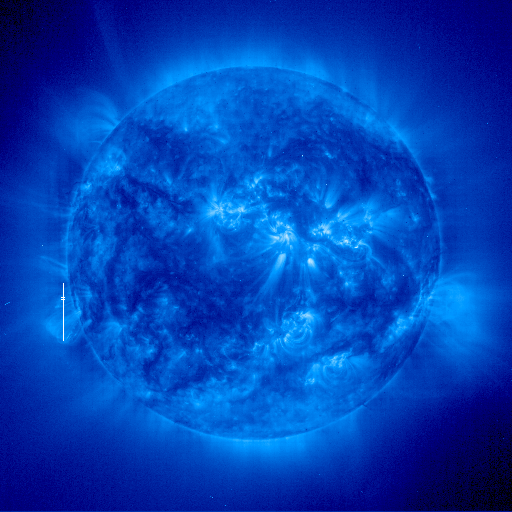
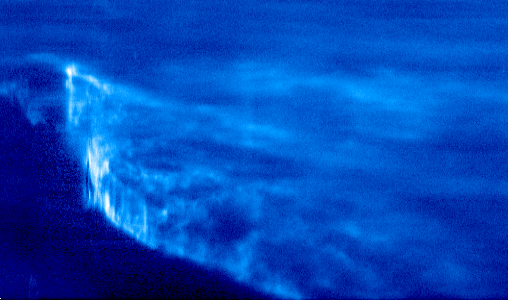
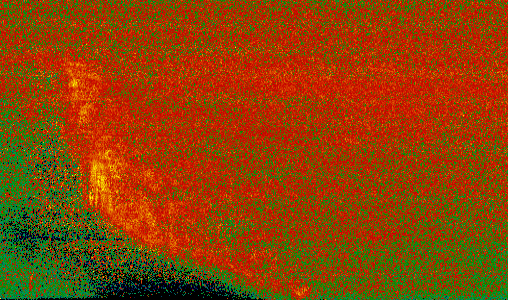
In a first approach, 231 "left" windows (format 38, 1108.26 Å on pixel 731) were analysed. This leads to a sequence of images approx. 6 minutes apart. - In a second approach, all formats were used; the 2D images are accordingly updated. - Meanwhile, EIT took images of the whole Sun approx. every 12 minutes. The SUMER slit points to a coronal loop system above an active region at the south east limb. During the time of the study, according to the events page, a C3.6 flare occured between 01:13 UT and 03:57 UT with a maximum at 02:31 UT. According to the EIT entries on our JOP 104 (Oct 2000) page, two CMEs occured (01:13-02:12 UT and 04:36-06:00 UT). SUMER observes a big brightening in Fe XIX, but otherwise not much like the other flare observations.
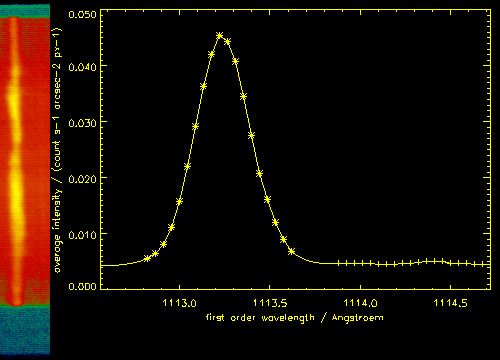
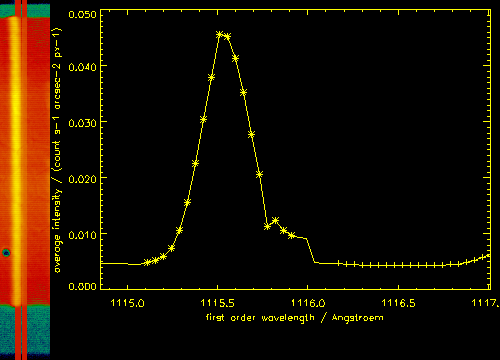
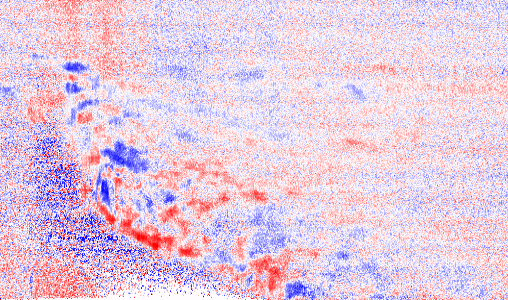
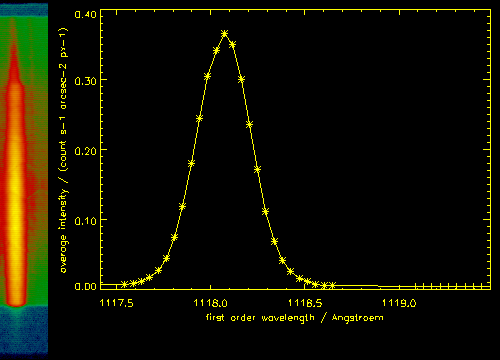
Representative lines were selected for analysis: One relatively cool transition region line, S III + Si III 1113.22 (30 000 - 63 000 K), one coronal line, Ca X 1115.51/2 (740 000 K), and one "hot" coronal line, that only shows up in flare situations, Fe XIX 1118.073 (7 700 000 K). The images below show the SUMER slit with time moving from left to right for approx. 24 hours. Shifts were determined relative to the (not very dynamic) Ca X line. - In the "right" window, which does not contain S III 1113.22, the comparable line S IV 1122.52 was used as a substitute to fill in the gaps.
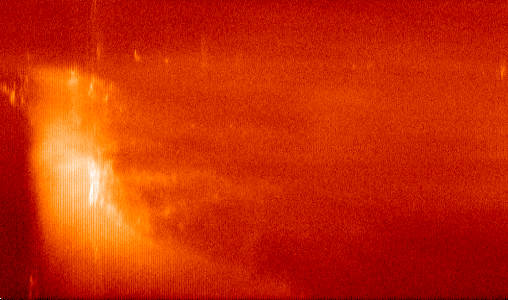
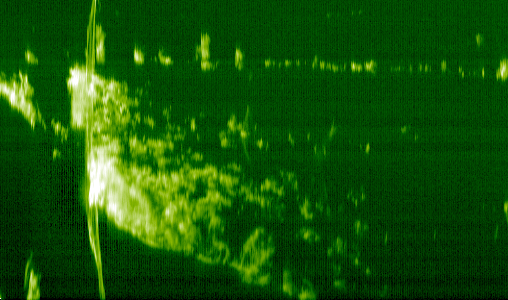
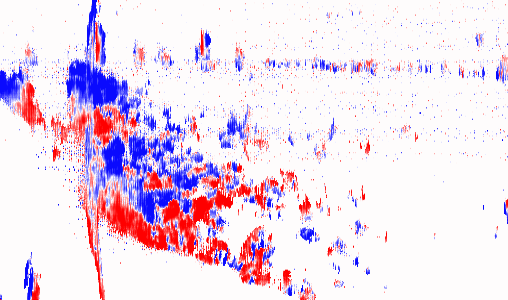
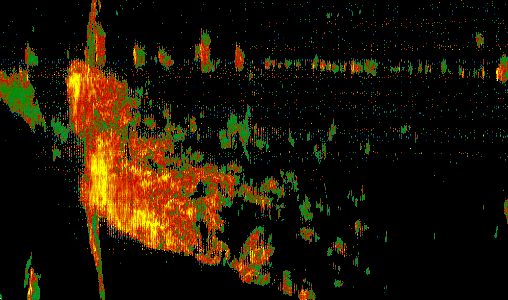
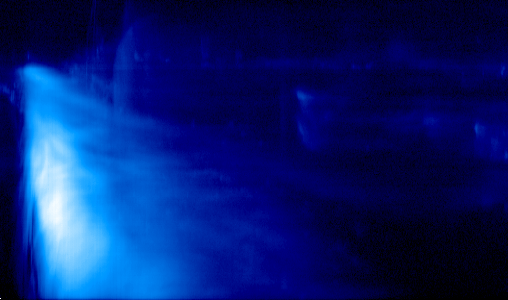
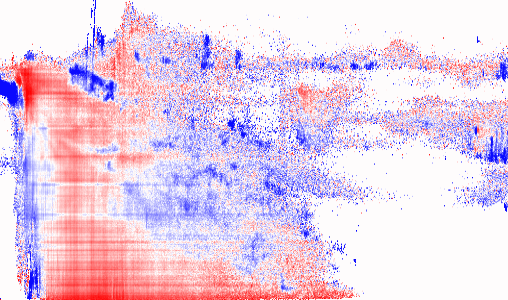
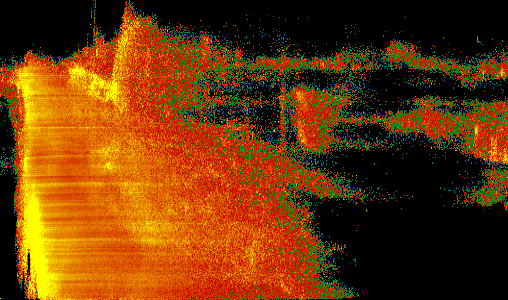
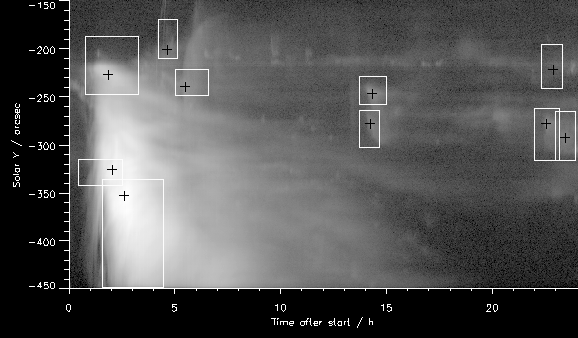
Time  Solar X Solar Y    Intensity    Size   Shift   Width
/UT   /arcsec /arcsec   /count s-1 /arcsec /km s-1 /km s-1
----- ------- ------- ------------ ------- ------- -------
01:48    -999    -237      13.8822      58      20      64
01:59    -999    -332      84.6271      26       8      61
02:33    -999    -358      115.728     108       8      74
04:36    -999    -212     0.627655      39      15      64
05:27    -999    -249      1.22376      26      23      70
14:10    -999    -286     0.607867      37      16      54
14:16    -999    -256      1.06688      28       8      55
22:30    -999    -286      1.08398      52      24      62
22:49    -999    -232     0.213790      44      25      63
23:23    -999    -300     0.458760      49      24      57
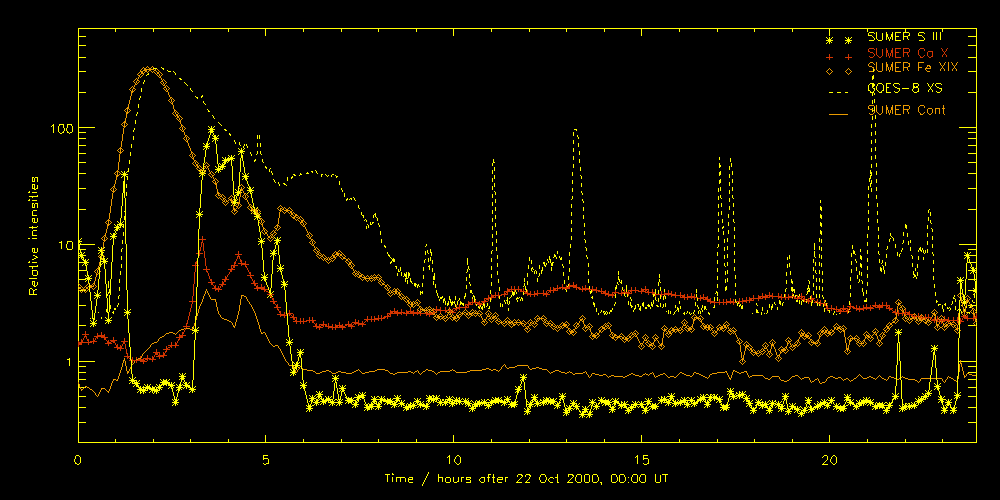

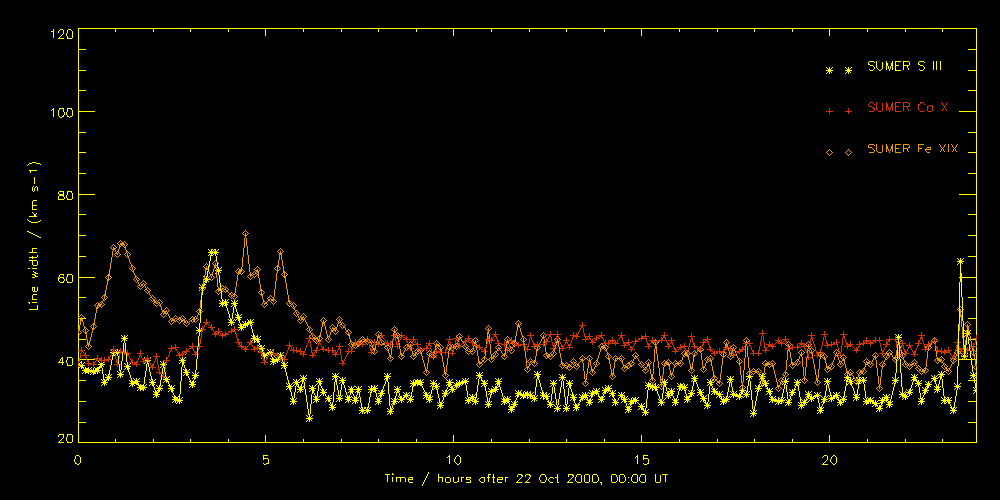
goes-time    in h after 22 Oct 2000, 00:00 UT
sumer_time   in h after 22 Oct 2000, 00:00 UT
intens_goes  GOES XS 0.5-4 in W / m2
intens_s3    in SUMER count / (line * 162.5 s * px)
intens_ca10
intens_fe19
intens_cont  Cont 1116 in count / (Å * 162.5 s * px)
shift_s3     in km/s
shift_ca10
shift_fe19
width_s3     in km/s
width_ca10
width_fe19
1 px corresponds to 4.0" x (300/287)".