Although the number of sunspots or the cycle length show excellent correlations with climate indicators, neither of these is expected to directly influence climate. They are just proxies of the solar magnetic activity. Of more direct potential relevance for climate are the Sun's irradiance and the quantity underlying all solar activity, the magnetic field. Unfortunately, regular and detailed measurements of the Sun's surface magnetic field are only available for a few decades, not long enough for comparison with climate. Records of the solar irradiance are available for an even shorter length of time. It is therefore very important to understand the physical processes leading to the variability, in order to successfully reconstruct the irradiance changes back in time for the pre-satellite period.
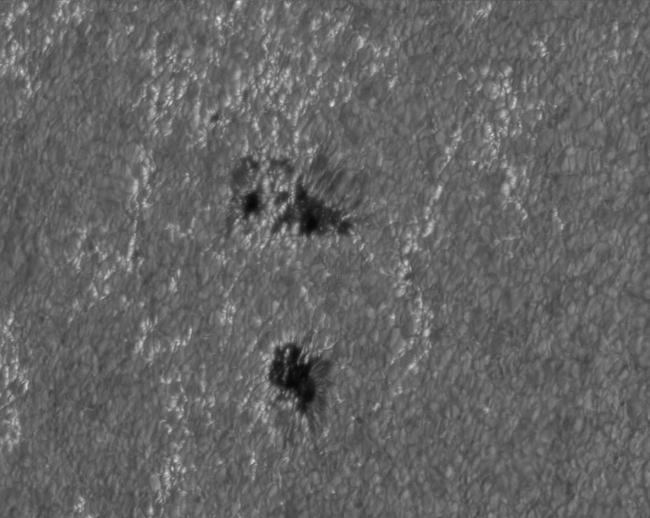
Most successful were models assuming that the variations of the total solar irradiance are essentially caused by the evolution of the solar surface magnetic field. Figure 1 illustrates a dip in total solar irradiance due to the passage of a sunspot group across the solar surface. A pair of small sunspots caused the darkening of almost 0.1%. A passage of a region with bright magnetic features, faculae, is illustrated in Fig. 2. These bright features are composed of magnetic elements that are much smaller than those composing dark spots, but they are by far more frequent. The number of both, sunspots and the small magnetic elements increases from activity minimum to maximum. However, the area covered by bright elements increases by a far larger amount than that covered by the sunspots. Consequently, the brightening due to faculae outweights the darkening due to the sunspots and leads to an increase of the irradiance at activity maximum.
Fig. 1. Dip in total solar irradiance measured by the VIRGO instrument on the SOHO spacecraft (red curve). The face of the Sun in white light on 5 selected days during the dip is also shown. Note the sunspots on the solar disc.
Fig. 2. The passage of a facular region across the solar disc in the SOHO MDI images and the corresponding change in the total solar irradiance recorded by the VIRGO instrument.
Support for the important role of the magnetic field at the solar surface is provided by the fact that the irradiance variability can be reproduced quantitatively by a simple three-component model, with the individual components representing the quiet Sun, faculae and sunspots. Figure 3 shows a comparison between measured and reconstructed solar irradiance. The excellent correspondence between the two time series suggests that the assumption underlying the model is correct and also demonstrates that on time scales up to the solar cycle our understanding of the sources of solar irradiance variations is relatively advanced.
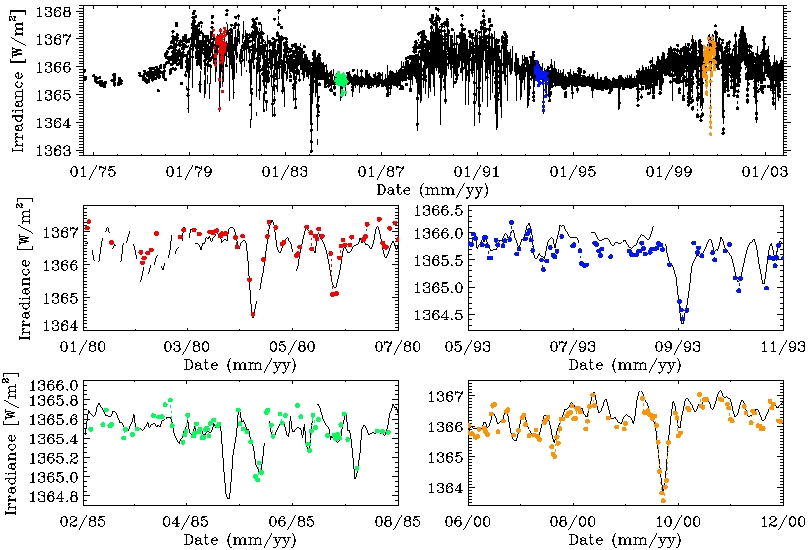
Fig. 3. Reconstruction (circles) of total solar irradiance from Kitt Peak NSO magnetograms for 3789 individual days between August 1974 and September 2003, from the minimum of cycle 21 to the descending phase of cycle 23. The PMOD/WRC (Switzerland) composite of irradiance measurements is represented by the solid line. The four bottom panels show a zoom-in to shorter intervals at different activity levels (indicated by the same colours in the top panel).
Solar irradiance variations show a strong wavelength dependence. Whereas the total (integrated over all wavelengths) solar irradiance changes by about 0.1% over the course of the solar cycle, the irradiance in the UV part of the solar spectrum varies by several to about 10% at 150-300 nm, and by more than 50% at shorter wavelengths, including the Ly-alpha emission line near 121.6 nm. On the whole, up to 60% of the total irradiance variations are produced at wavelengths below 400 nm (Fig. 4). These variations may have a significant impact on the Earth's climate system. Ly-alpha, the strongest line in the solar spectrum, takes an active part in governing the chemistry of the Earth's upper stratosphere and mesosphere. Also, radiation around 200 nm is important for photochemical ozone production, whereas the radiation at about 180-320 nm is the main heat source in the stratosphere and mesosphere.
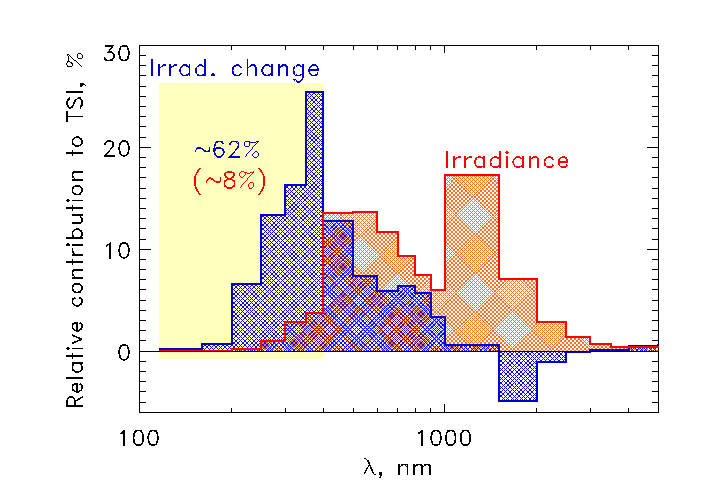
Fig. 4. The relative contribution of different wavelength ranges to the total solar irradiance (red histogram) and its solar cycle variations (blue histogram). About 60% of the total irradiance variations over the solar cycle are produced at wavelengths shorter than 400 nm (marked by the light yellow area), whereas the contribution of this spectral range to the total irradiance is only around 8%. Note different size of bins: about 40 nm below 200 nm, 50 nm between 200 nm and 400 nm, 100 nm between 400 and 1000 nm and 500 nm at yet longer wavelengths.
Obtaining an understanding of the processes leading to the variability on a solar-cycle time scale is not sufficient, however. A purely periodic variation of solar brightness does not produce a long-term change in solar brightness and hence does not contribute to global warming. The change in the amplitude of the solar cycle produced an increase of less than 0.05% in solar irradiance over the last 150 years. Is there any reason to believe that the Sun has exhibited larger changes than these over the last few centuries?
Support to this is provided by our model (Solanki et al. 2000, Nature 408, 445), which is based on the observation that solar activity cycles actually overlap. Indeed, considerable magnetic flux from the old cycle is still present on the solar surface when flux due to the new cycle starts to erupt. One can distinguish between flux belonging to the two cycles from its location on the solar surface and the relative orientation of the positive and negative polarities of the field joined together by a magnetic loop. Consequently, the magnetic flux on the Sun is never allowed to decay completely, unless there is a long gap similar to the Maunder minimum between two cycles. In Fig. 5 the predictions of the model for the open magnetic flux are compared with the reconstruction of Lockwood et al. and with the concentration of 10Be in ice cores. This radioactive isotope is produced by the interaction of cosmic rays with air molecules in the upper atmosphere. Since the cosmic-ray intensity is modulated by processes that scale with the strength of the Sun's open field, the 10Be production rate is expected to roughly follow the Sun's open flux. Indeed, the three curves agree very well (high frequency noise in 10Be is of no importance here).
Fig. 5. Evolution of the open magnetic flux at the solar surface since the end of the Maunder minimum in 1700. Our model predictions (Solanki et al. 2000, Nature 408, 445) are represented by the red curve, reconstructions by Lockwood et al (1999, Nature 399, 437) based on geomagnetic indices by the green curve beginning around 1860 and the 10Be concentration in ice cores (corresponding to the inverted scale on the left y-axis, Beer et al. 1990, Nature 348, 520) by the black curve.
One interesting aspect is that according to this model the secular evolution of both the Sun's open and total magnetic flux follows a combination of solar-cycle amplitude and length. This is the first indication on a physical basis that cycle length, which has been found to correlate very well with climate indicators, indeed influences solar irradiance, a parameter that may be of direct relevance to the climate.
Finally, knowledge of the magnetic flux allows the solar irradiance to be reconstructed. The reconstructed total solar irradiance is shown in Fig. 6. The model predicts an increase in the cycle-averaged TSI since the Maunder minimum of 1.3[0.9-1.5] Wm-2.
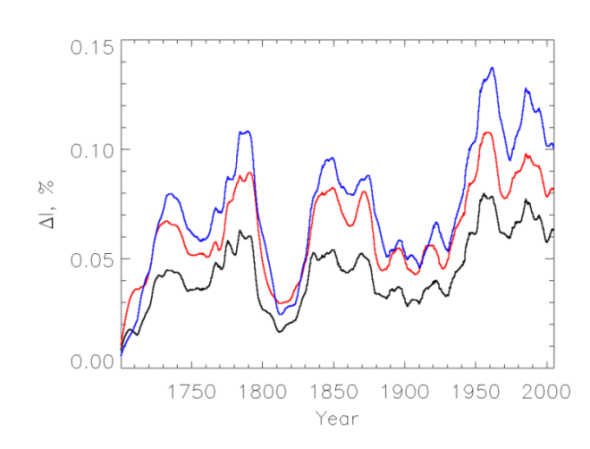
Fig. 6. 11-year running mean of the reconstructed total solar irradiance (red line). The black and blue lines show the model obtained under extreme assumptions and represent the lower and upper limits on the magnitude of the secular increase in the TSI, respectively.