SIR
Spectrometer InfraRed-2 onboard ISRO's Chandrayaan-1 Mission to the Moon
 The SIR-2 instrument is an infrared spectrometer build for remote sensing of the lunar surface. SIR-2 (Spectrometer InfraRed) represents the German scientific contribution to the Indian Chandrayaan-1 lunar mission. The project is funded by the Max Planck Society (MPS) and partly by the European Space Agency (ESA) in collaboration with the University of Bergen (Norway) and the Polish Academy of Science.
Science objectives
- Map lunar surface composition by infrared fingerprints of minerals
- Learn more about lunar history and formation from the composition of different surface features (Mare, Crater Peaks) and the changes in the continuum slope over the Moon
- Search for the presence of water in the form of hydrated minerals or ices at the lunar poles in the permanently shaded areas
- Extend the scientific knowledge about resources for a later human exploration of the Moon
The Instrument
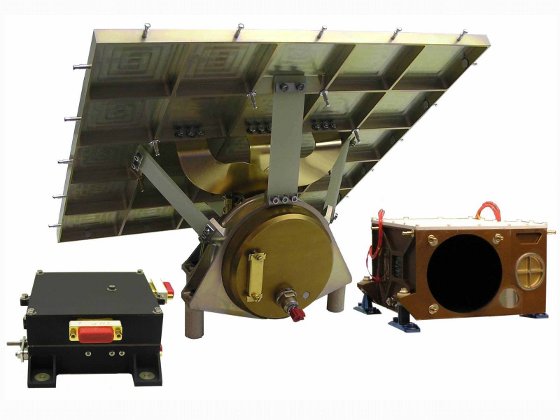
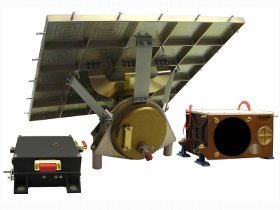
The SIR-2 is a redesigned, highly compact, monolithic grating, near-infrared spectrometer operating in the wavelength range from 0.9 to 2.4 micrometer with a spectral resolution of 6 nanometres and >100 S/N. The reflected light from the Moon is focused onto a fibre, which leads the light to the spectrometer body. At the grating the light is dispersed and then detected by an IR sensor across 256 pixels. Each pixel is a photodiode converting the incoming light into an electronic signal.
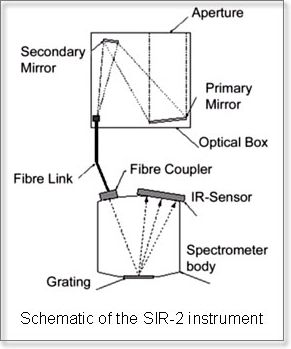
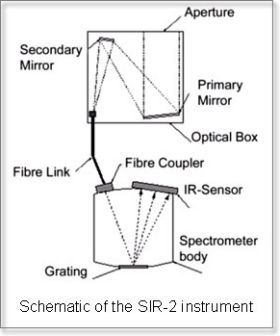 Figure 2. Schematic of the SIR instruments.
Since the SIR-2 is a footprint spectrometer, each spectrum represents the surface characteristics of an ellipse whose size is defined by the opening angle of the instrument and the distance between the spacecraft and the ground, in this case around 220 meters.
The Science behind the project
Every planetary surface consists of different minerals and of the rocks they form. On the Earth the rocky surface is nearly everywhere covered by soil, a mixture of eroded rocks and organic remains. With no biosphere on the Moon the lunar soil is pulverized rock, but the processes of erosion are quiet different from those on Earth. Since we cannot go and take samples from all surfaces in our solar system to investigate their composition, we use the characteristic features which those minerals imprint on the reflected light from the Sun to identify them from space. Some portions of the solar spectrum are more strongly absorbed and scattered, and thus less reflected than others by minerals. In those wavelength regions we see a dip in the reflected light that we call an absorption band. One can compare it to the unique fingerprint every human being has. The near-infrared is extremely well suited for identifying minerals from space because the most abundant and common minerals in the solar system show characteristic absorption features in this wavelength range which clearly distinguishes them from each other.
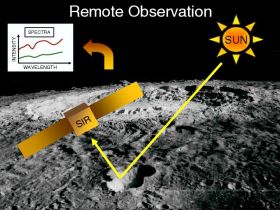 Figure 3. Principle of Remote Sensing.
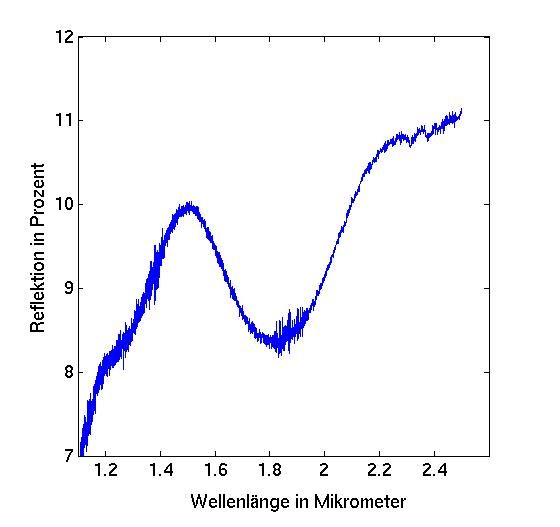
In the figure below an example for a near-infrared spectrum is given. A Lherzolite rock piece was pulverized and examined with an infrared spectrometer. Olivine and Pyroxene are the major minerals in this rock type, and together with Plagioclase these three minerals are the major minerals on the lunar surface and in the solar system. In a mixture of minerals the different features are superimposed on each other, but not necessarily in a linear way. Depending on the chemical composition pyroxenes show absorption bands around 1 micrometer or around 1 and 2 micrometer(s) in the near-infrared while Olivine has a broad-band around 1 micrometer. Since our Lherzolite rock contains of Olivine and Pyroxene its spectra exhibits a Pyroxene band at 1.8 micrometers and a band at 1 micrometer, from which we can only see the drop to a shorter wavelength. This 1-micrometer band is a mixture of the 1-micrometer band of Olivine and that of Pyroxene. With the SIR instruments spectra of this kind are taken all along the orbit between 0.9 and 2.4 micrometers.
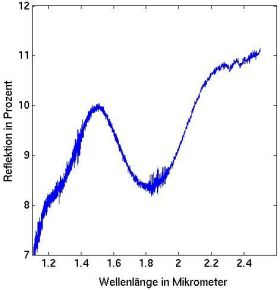 Figure 4. Reflectance spectra of a Lherzolite stone powder.
Learning from lunar near-infrared spectra
Three major pieces of information from which we can draw conclusions about the surface composition and the surface age are confined in the spectra of reflected sunlight in the near-infrared.
-
Overall reflectance or the question: "Do we have a bright or a dark surface?" This gives a first hint on the mineral composition and the age. The lunar, surface as seen from the Moon, shows brighter and darker areas. The bright areas are either young or contain great amounts of the mineral Plagioclase, which is the most common mineral on the lunar surface. Dark regions contain greater amounts of Pyroxen and contributions from Ilmenite as well, which has the talent to stongly reduce the overall reflectance without producing absorption bands in the near-infrared.
-
Position, depth and broadness of absorption bands or the question: "What kind of minerals or mineral mixtures make up the surface area we observe?" From the appearance of absorption bands we can directly draw conclusions on the surface composition by comparison with laboratory spectra.
-
Continuum slope or the question: "How old is the surface?" On the Moon and other bodies without atmosphere a special process called "space weathering" leads to a darkening of the surface with time. This process reduces the reflectance slightly stronger at shorter wavelengths and increases the continuum slope, namely the slope of the spectral reflectance under negligence of absorption bands.
With the technique of remote sensing one is able to obtain information from the upper micrometers of the surface only. To learn about the three-dimensional structure of the Moon we can take advantage of the huge impacts in which the Moon was exposed to in the last 4 billion years, which brought material from a larger depth into our reach. The peaks of large impacts are known to expose material from several kilometers depth, and the lavas in the mare represent molten material from the source regions up to 300 km depth. Using those tools we can study not only the surface of the Moon but also a part of its inner structure. In this respect we learn about its history and because the formation of the Moon is closely interwoven with the formation of Earth we also learn more about our own planet.
Related links