|
The SOUSY - Svalbard - Radar (SSR)
Some examples of the SSR operation in 1999

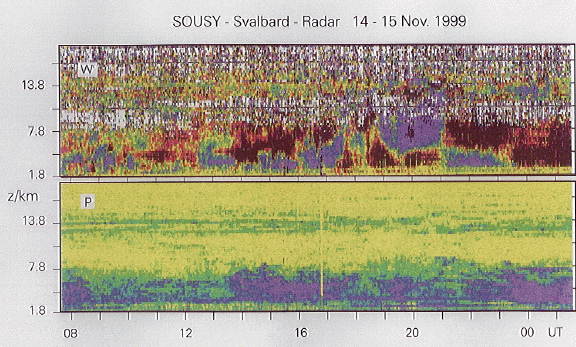
Height-time-intensity plots of signal power P (lower panel) and
radial velocity w in the vertical beam direction (upper panel),
recorded with the SOUSY-Svalbard-Radar between 07:39:18 UT on
14 November 1999 and 01:35:05 UT on 15 November 1999, showing
strong mountain lee waves.
The velocity scale is between -0.5 ms-1 (black) and +0.5 ms-1
(magenta); velocity estimates are affected by noise below and above
the tropopause(~13 km). The power scale is between 0 dB at the noise
level (yellow) and 40 dB (magenta).

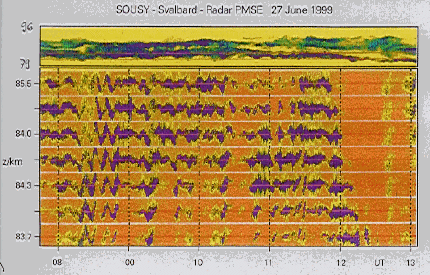
Height-time-intensity plot and dynamic spectra of Polar Mesosphere Summer
Echoes,
showing gravity wave oscillations.

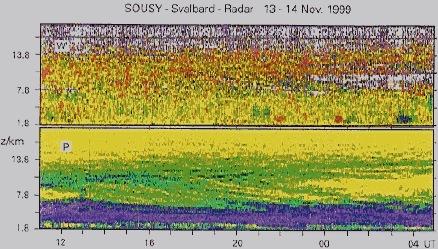
Passage of a warm front over Svalbard:
Radial velocity in vertical beam
and height-time-power plot.
Reception was with 4 Yagis only.
|
