SUMER study: Long rasters at 790, 786 Angstroem
- date, time: 19.Feb.96, 23:07 UT - 20.Feb.96, 09:15 UT
- field of view: 135 arcsec E - 135 arcsec W, 60 arcsec N - 44 arcsec S
- slit: 1.0 arcsec x 120 arcsec, centered (number 4)
- raster step size: 0.75 arcsec (2 elementary steps)
- exposure time: 10 seconds
- telemetry: 10(scans)*2(lines)*360 images of 50 spectral x 120 spatial
pixels (format 10)
- compression: bytescale-min-max (method 1)
- wavelengths:
790.20 Å on reference pixel 280 of Detector A
786.50 Å on reference pixel 456 of Detector A
- rotation compensation: standard
- binning: no spectral, no spatial
- on-board flat field correction: no
Remarks: 10 scans were executed in alternating directions. Only the
first scan is shown (for both lines). The whole study in O IV 790.2 can be
downloaded as an animation (see below). The rest of the study in S V 786.5 is
not presented here; the line is weaker and the results noisier.
Spectral windows


Average detector image, average profile.
O IV 790.2 (170 000 K)
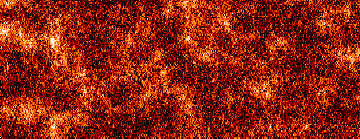

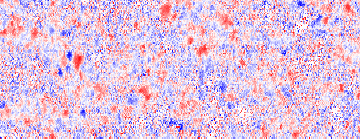

Continuum intensity, line intensity,
line shift, line width.
S V 786.5 (170 000 K)
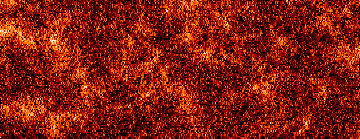

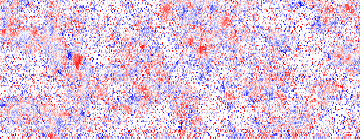

Continuum intensity, line intensity,
line shift, line width.
Animation of O IV scans
When the scans are viewed consecutively, the dynamic of the transition region
becomes visible. Please note that each scan takes approximately one hour,
so the whole animation covers 10 hours.
The first animation shows the complete scans. Download the IDL/XDR restore file
O4MOVIE1_XDR.RST
(2150 KB) and the small IDL routine
O4MOVIE1.PRO
and then start the animation by entering
IDL> .run o4movie1
The second animation shows a subset of the scans, corrected for solar rotation
and the effect of scanning in alternate directions. Download the IDL/XDR
restore file
O4MOVIE2_XDR.RST
(1500 KB) and the small IDL routine
O4MOVIE2.PRO
and then start the animation by entering
IDL> .run o4movie2
Both IDL routines give the choice to view an endless animation of either
continuum intensity, line intensity, line shift or line width.
Temporal behavior
While the fine structure changes from one scan to the next, the underlying
network structure appears to be quite stable (and similar in continuum and
O IV line) over the ten hours. This is demonstrated
by averaging the corrected subsets mentioned above. If you click on the images
you will find the time series of continuum and O IV line, respectively.

10-h-average of continuum, O IV line
IED, 07.Jun.00


