 SUMER
Study: Flare Watch 21 Apr 2002
SUMER
Study: Flare Watch 21 Apr 2002
SUMER
Study: Flare Watch 21 Apr 2002
SUMER
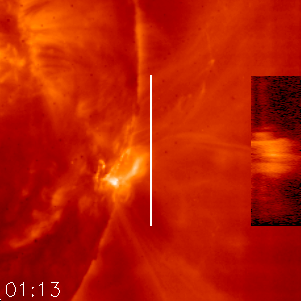
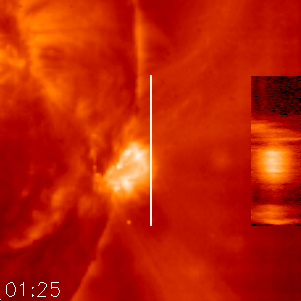
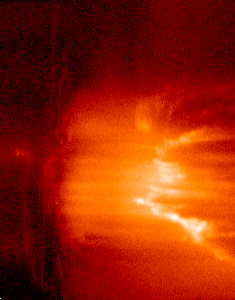
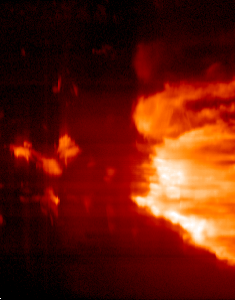
Study: Flare Watch 21 Apr 2002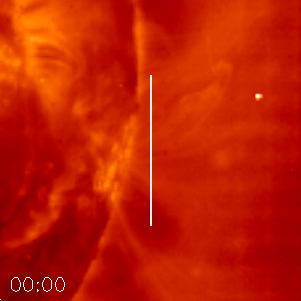 you will see an animation of EIT images during the four hours that include the
SUMER study described below. The position of the 4"x300" SUMER slit is marked.
The animation covers the X flare and the following CME.
you will see an animation of EIT images during the four hours that include the
SUMER study described below. The position of the 4"x300" SUMER slit is marked.
The animation covers the X flare and the following CME.
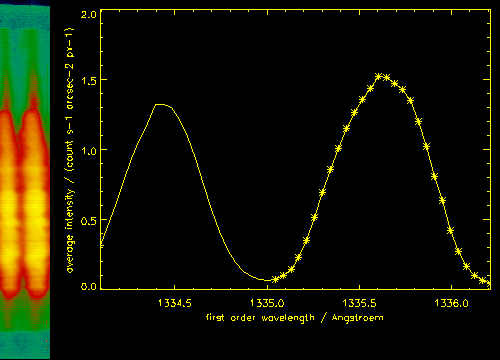
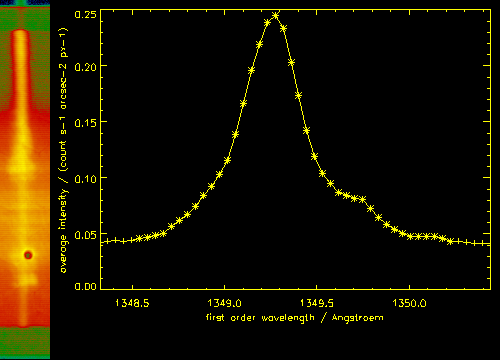
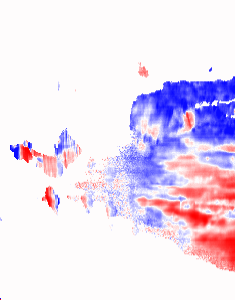
If you click on the second image
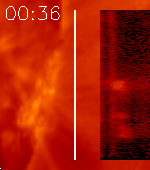 you will see an animation of SUMER spectra during the first (one hour) phase
of the X flare, combined with the first EIT images that were taken in parallel.
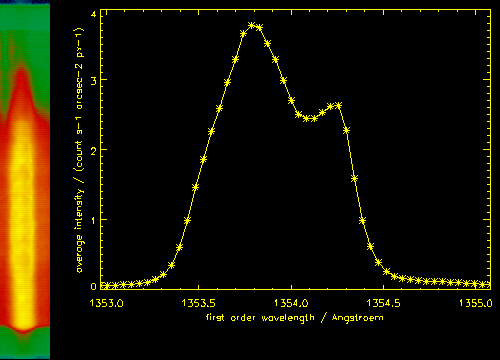
The spectral window contains approx. 2 Å around the Fe XXI (1354 Å)
line, which means that velocities up to +/- 240 km/s can be observed in plasma
of ~10 000 000 K.
you will see an animation of SUMER spectra during the first (one hour) phase
of the X flare, combined with the first EIT images that were taken in parallel.
The spectral window contains approx. 2 Å around the Fe XXI (1354 Å)
line, which means that velocities up to +/- 240 km/s can be observed in plasma
of ~10 000 000 K.
Notes: In a first approach, three full detector images (format 2) were neglected and only images in format 8 were put together. Deadtime correction was neglected because of a count overflow.

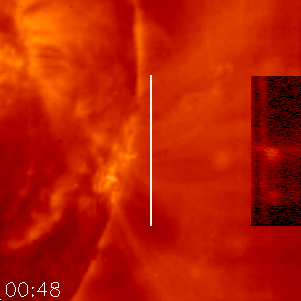
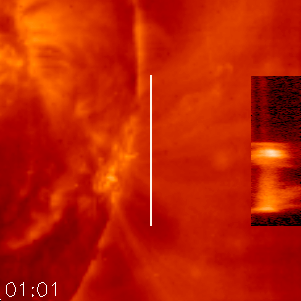
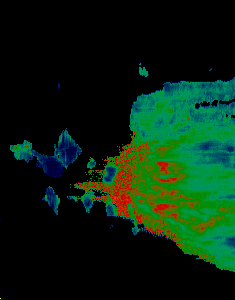
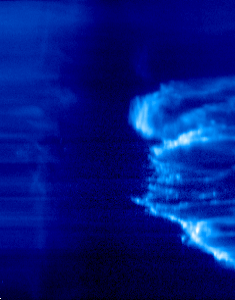
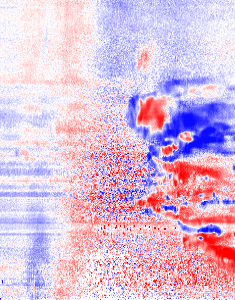
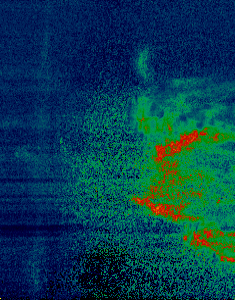
SUMER observes the first sign of the flare at 00:48 UT when a shock front arrives with high Doppler flows (> 300 km/s) in Fe XXI. At 00:54, the flare site brightens and oscillation events can be observed. Around 01:15, SUMER is overexposed in Fe XXI. After 02:15, a CME is seen in Fe XII, C II, and Continuum. A spatial/temporal correlation of Fe XXI and Continuum ("Bremsstrahlung") is observed in the flare phase, as well as a correlation of Fe XXI and C II, incl. their Doppler shifts.
Parts of these observations were already recorded for earlier flares and have been (or will be) published, e.g.
 C II
C II
 Fe XII, Continuum
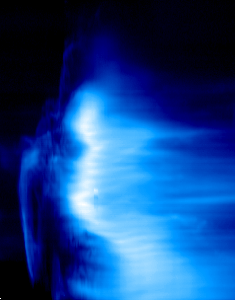
 Fe XXI
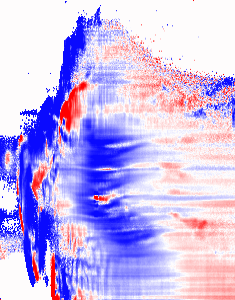
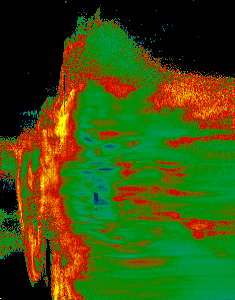
In the 2D images below, observation time runs from left to right. Images show continuum and line radiances on a logarithmic scale, line shifts scaled between -50 and +50 km/s, and line widths scaled between 10 and 150 km/s.
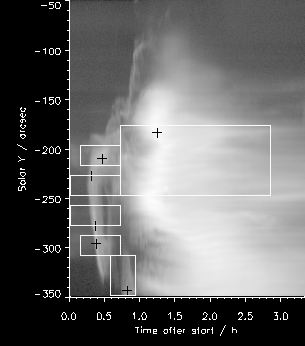
Time  Solar X Solar Y    Intensity    Size   Shift   Width
/UT   /arcsec /arcsec   /count s-1 /arcsec /km s-1 /km s-1
----- ------- ------- ------------ ------- ------- -------
00:54     989    -230      15.6690      20      58     145
01:03     989    -213      39.3676      20      63     132
00:57     989    -280      27.7430      20     110     122
00:58     989    -298      26.1288      20      95     132
01:23     989    -345      7.80056      40     101     147
01:49     989    -187      589.215      70      72     150