The mean global surface temperature has increased by about 0.9° to 1.0°C since the late 19th century, and by about 0.7° to 0.8°C over the last 40 years (see Fig. 1). The warming occurred largely during two periods, between 1910 and 1940 and since the mid-1970s. Warming is evident in both sea surface and land-based surface air temperatures.
Fig. 1. Combined global land and marine surface temperatures (°C) from 1880 to 2017. The solid curve represents smoothing of the annual values shown by the bars to suppress sub-decadal time-scale variations. (Image source: Climatic Research Unit, UK; see also IPCC Reports)
A variety of proxy records suggest that Northern Hemisphere summer temperatures in recent decades appear to be the warmest since at least about 1400 AD (Climate Change 1995, 2nd Report of the Intergovernmental Panel on Climate Change, IPCC). Data prior to 1400 are too sparse to allow the reliable estimation of global mean temperature. However, ice core data from several sites around the world suggest that 20th century temperatures are at least as warm as any century since at least about 1400, and at some sites the 20th century appears to have been warmer that any century for some thousands of years.
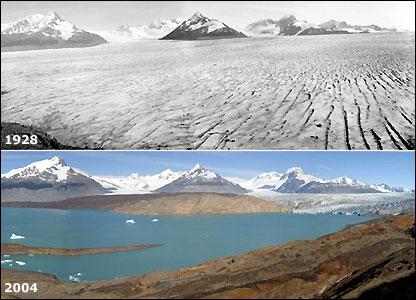
Indirect indicators, such as borehole temperatures and glacier shrinkage, provide independent support for the observed warming. The world's glaciers and ice caps have lost massive amounts of ice in the 20th century, with the process accelerating since 1988. The rate of ice loss since 1988 has more than doubled. Some glaciers around the world now are smaller than they have been in the last several thousand years (see Fig. 2).
 |
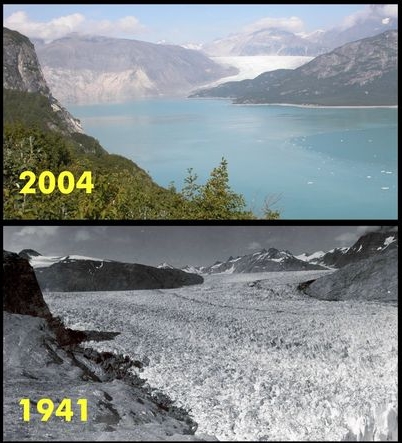 |
Fig. 2. Left: The Upsala Glacier, a large valley glacier in Argentina's Los Glaciares National Park, in 1928 and 2004 (Greenpeace). Right: Comparison photos of Muir and Riggs Glaciers in Glacier Bay National Park and Preserve, Alaska ( Global Warming Art).
Melting of glaciers as well as ocean warming and expansion lead to sea level rise. Over the last 100 years global sea level has risen by about 10 to 25 cm (Fig. 3), based on analyses of tide gauge records. It is likely that much of the rise in sea level has been related to the concurrent rise in the global temperature over the last 100 years. On this time-scale, the warming and consequent expansion of the oceans may account for about 2 to 7 cm of the observed rise in sea level, while the observed retreat of glaciers and ice-caps may account for about 2 to 5 cm. The rate of the observed sea level rise suggests that there has been a net positive contribution from the huge sheets of Greenland and Antarctica, but the observations of the ice sheets do not yet allow meaningful quantitative estimates of their separate contributions. Sea level is predicted to rise 40 to 65 cm by the end of this century.
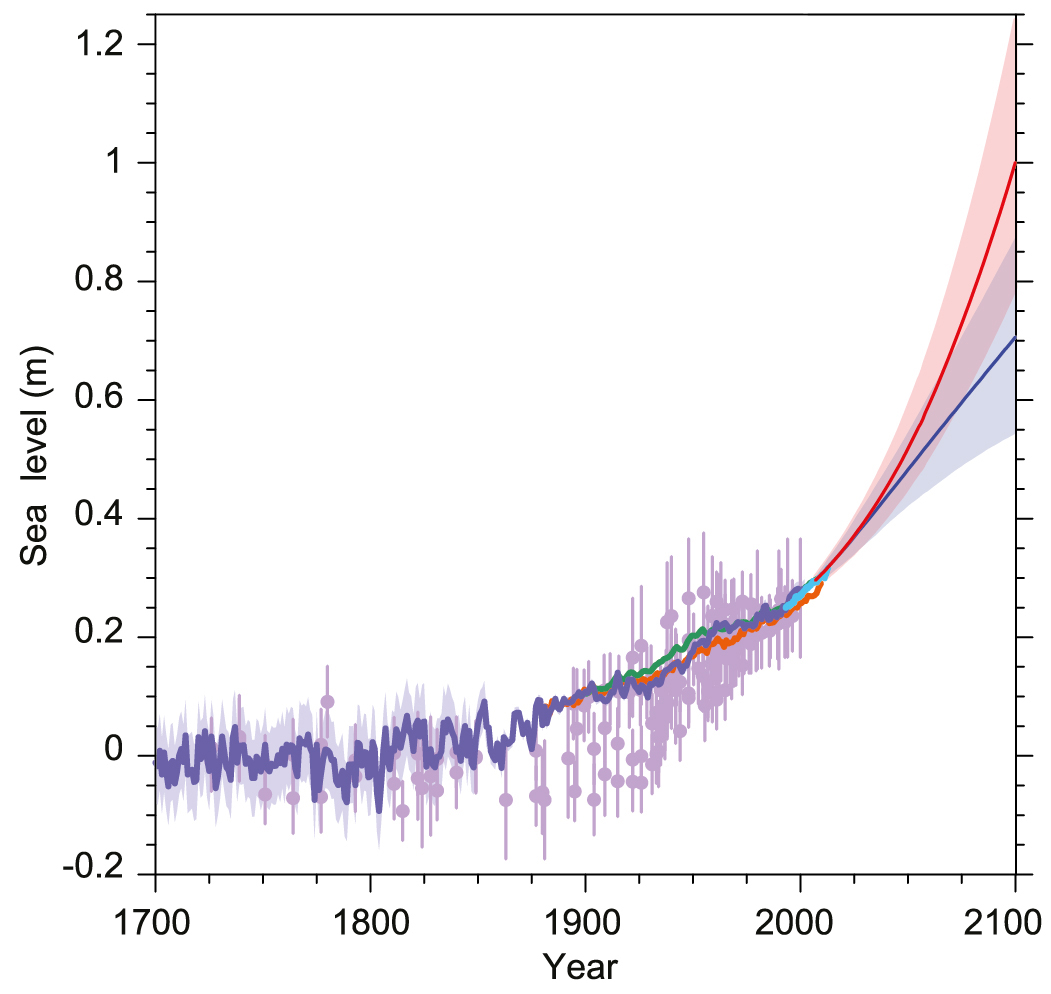
Fig. 3. Compilation of paleo sea level data, tide gauge data, altimeter data, and central estimates and likely ranges for projections of global mean sea level rise (blue and red for two different scenarios), all relative to pre-industrial values. ( Fig. 13-27 from the IPCC-5 WG1 Report, 2013).
Climate can vary for many reasons. In particular, human activities can lead to radiative forcing through changing the atmospheric concentrations and distributions of greenhouse gases and aerosols. The amount of carbon dioxide in the atmosphere has increased by more than 25% in the past century and since the beginning of the industrial revolution (see Fig. 4). There is no doubt that this increase is largely due to human activities, in particular fossil fuel combustion. Prior to this recent increase, CO2 concentrations over past 1000 years, a period when global climate was relatively stable, fluctuated only slightly around the average value. Concentrations of other greenhouse gases has also increased (check here for the current concentrations compared to the pre-industrial ones).
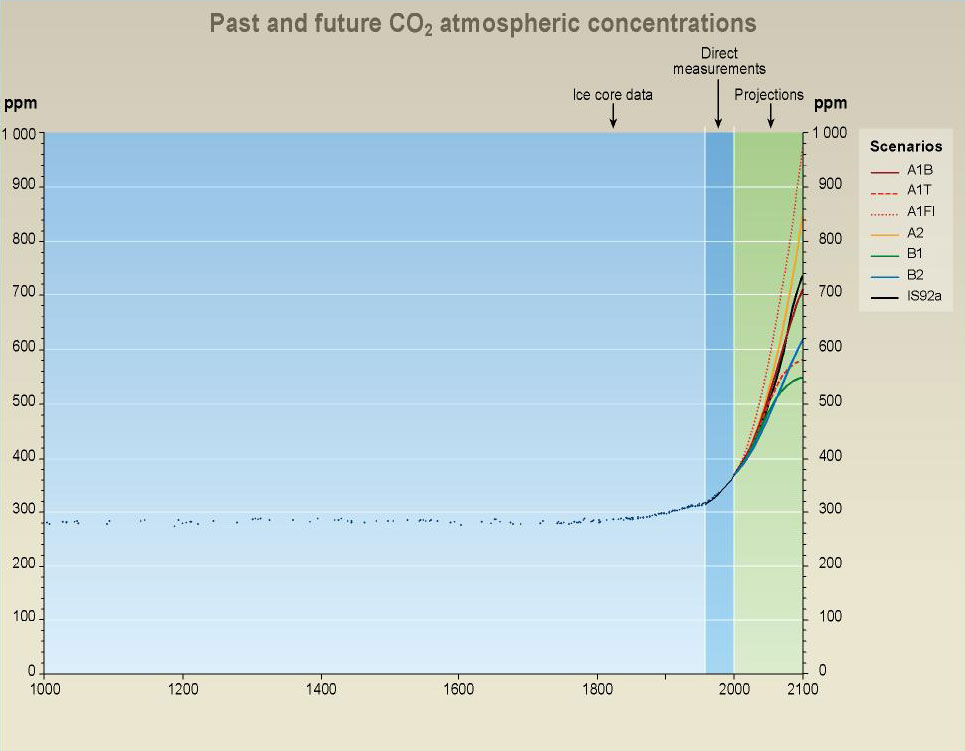
Fig. 4. Atmospheric CO2 concentration from year 1000 to year 2000 from ice core data and from direct atmospheric measurements over the past few decades. Projections of CO2 concentrations for the period 2000 to 2100 are based on model predictions (see IPCC Report-2001 for more details)
On the other hand, since the Sun is by far the largest supplier of energy to the Earth's surface, any change in the radiative output of the Sun also affects the energy balance of the Erth's surface and atmosphere, so that at some level it influences our climate, too. But how strongly does the Sun vary and to what extent does it influence the Earth's climate? It is important to find a firm answer to these questions in order to estimate the solar contribution into the global warming and in particular to determine its weight relative to that of the man-made greenhouse gases.