The Sun varies on all time scales accessible to observations, from a fraction of a second to centuries, and is expected to change also on longer time scales right up to its main sequence life time. The way the variability manifests itself, its sources and its statistical properties (periodic, cyclic, chaotic, stochastic) all depend on the time scale of interest. Variability of different types can also co-exist at a given time scale. For example, on a time scale of minutes periodic, chaotic and stochastic phenomena are found. Chaotic signals at this time scale are observed in solar radio bursts. In addition, the Sun exhibits a rich spectrum of non-radial oscillations with periods of around 5 minutes. In Fig. 1 the period of the solar oscillations is plotted versus horizontal wavelength. These p-mode oscillations are thought to be excited by the turbulent motions present in the solar convection zone, i.e. by stochastic `noise'.
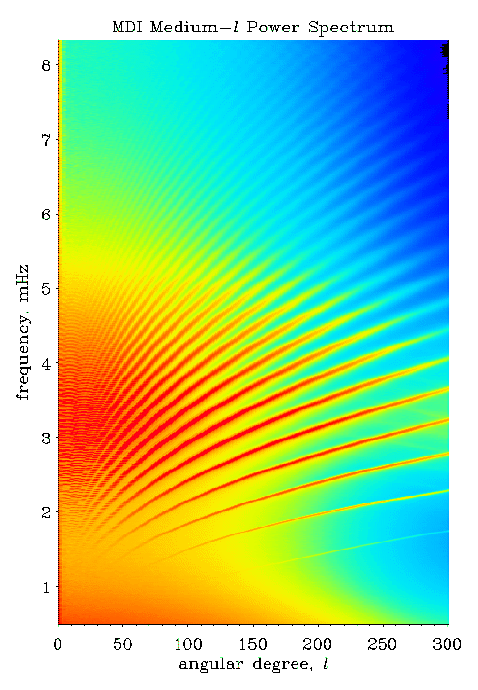
Fig. 1. The l-nu (period versus horizontal wavelength) diagram obtained by the Michelson Doppler Imager (MDI) on the SOHO spacecraft. Since only waves with specific combinations (related to the Sun's interior structure) of period and horizontal wavelength resonate within the Sun, they produce the fine-tuned `ridges' of greater power. (Image source: SOHO)
At longer time scales of days to centuries the source of solar variability is in one way or another the magnetic field. It produces both stochastic and cyclic variability. The major exception is the period of 27.2573 days due to solar rotation (the Carrington rotation period; although different latitudes rotate at different rates). The stochastic variability on minutes to months time scales produced by the magnetic field is on the one hand related to the solar dynamo, which leads to the seemingly random emergence of magnetic flux (which forms active regions containing sunspots) and on the other hand to the interaction of the magnetic field with convection, which leads to the evolution and destruction of active regions and also produces such spectacular and dynamic phenomena as solar flares or coronal mass ejections.
The most prominent solar time-dependent phenomenon is the sunspot cycle or, more generally, the solar activity cycle with a period of roughly 11 years. Within this period of time the area covered, for example, by sunspots increases by over an order of magnitude before dropping again. This area is plotted as a function of time over an interval containing 11 cycles in the lower frame of Fig. 2.

Fig. 2. The butterfly diagram (top) shows the latitudes of sunspots as a function of time, in particular exhibiting the evolution of these latitudes over the solar cycle. Sunspots appear mainly at high solar latitudes at the beginning of a new cycle but move closer to the Sun's equator when the cycle progresses. Daily sunspot area record (bottom). (Image source: http://solarscience.msfc.nasa.gov/SunspotCycle.shtml)
Over the activity cycle many more observables change than just the number of sunspots or the area covered by them. For example, the latitudes at which the sunspots are present evolve over the solar cycle, producing the so-called butterfly diagram shown in the upper panel of Fig. 2. Obviously, emission in a number of spectral bands (including the total solar irradiance, Fig. 3, which is the wavelength integrated flux of the Sun measured above the Earth's atmosphere) changes in step with the sunspots, as do many more indices and features (e.g., the frequencies of solar p-modes). The total solar irradiance has been measured since 1978 (using radiometers onboard spacecraft) with sufficient accuracy to detect intrinsic solar changes. In addition to the presence of the 11-year cycle with an amplitude of roughly 0.1%, significant shorter fluctuations are present which give the diagram a noisy appearance. These fluctuations are mainly solar and the amplitude of this `noise' changes in phase with the cycle.
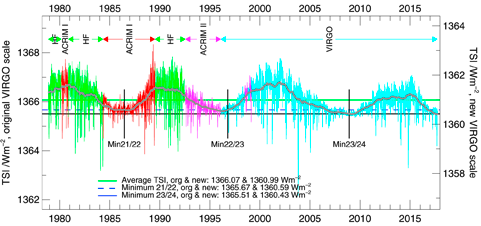
Fig. 3. Composite of total solar irradiance covering about 3.5 solar cycles, as measured by radiometers flying on spacecraft. Data from four instruments have been used to create this composite. (Image source: PMOD/WRC, Switzerland)
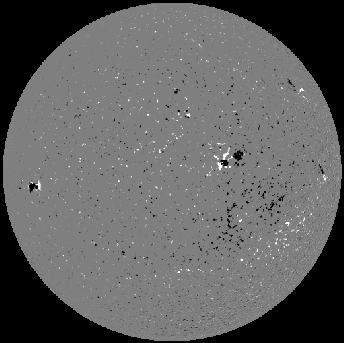
From solar activity minimum to maximum the face of the Sun changes completely if it is observed at the appropriate wavelengths (e.g., cores of strong lines, radio, EUV and X-rays). Underlying all these changes is the magnetic field, which itself evolves strongly from activity minimum to maximum. Figure 4 shows two magnetograms one recorded near minimum, the other near maximum of activity of solar cycle 23. White and black patches denote the presence of positive and negative polarity flux, respectively. Obviously, many more active regions, seen here as large bipolar patches of field, are present at activity maximum. Also seen is a network of field covering the whole Sun with a salt-and-pepper pattern at all times during recent cycles.
 |
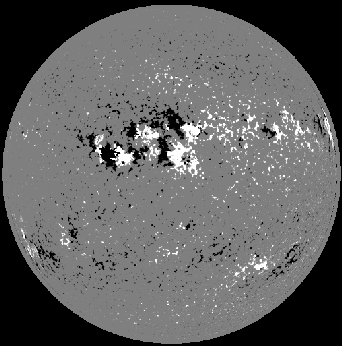 |
Fig. 4. Magnetograms of the full solar disc obtained by the MDI instrument on SOHO in 1996 (left) and 2000 (right) and averaged over 50-minutes.
A look at Fig. 2 reveals that in spite of many similarities each cycle is distinct from the others, most obviously in amplitude, less obviously in the cycle length, the maximum latitudes at which sunspots are seen, and in other parameters. The length of the solar cycle during the last roughly 150 years changed by approximately 20%. A much more drastic change happened in the 17th century, when hardly any sunspots were seen during more than 50 years (Fig. 5). This period is called the Maunder minimum.
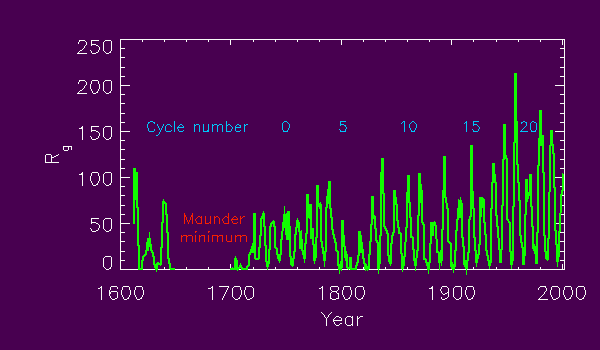
Fig. 5. The group sunspot number for the last 400 years. Hardly any sunspots were seen in the second half of the 17th century.
The coincidence of the Maunder minimum with the little ice age, as well as the excellent correlation of solar cycle length with Northern hemisphere air temperature over land masses, suggests that solar variations have an effect on the Earth's climate, although chance correlations cannot be ruled out. This is particularly strong caveat since a priori neither the number of sunspots nor the cycle length are expected to directly influence climate. Of more direct potential relevance for climate are the Sun's irradiance and the quantity underlying all solar activity, the magnetic field. Unfortunately, regular and detailed measurements of the Sun's surface magnetic field are only available for a few decades, not long enough for comparison with climate. Records of the solar irradiance are available for an even shorter length of time. In order to uncover a possible connection between solar irradiance and magnetic field variations and climate, it is necessary to extend the irradiance record to earlier times with the help of models.