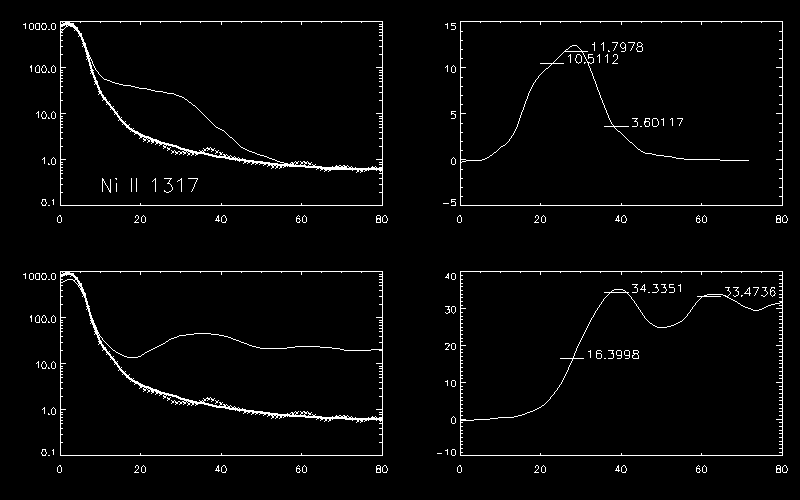
Upper half right, the relative intensity increase (cf. Results I) is shown vs. distance from the limb. The data (X) are not fitted and thus still noisy. Therefore, the increase is also calculated with the fitted stray light values (straight line). The region 15" to 35" above the limb, where the average profiles are calculated, is marked, together with the average intensity increase in this region.

The lower half shows the situation for the (bright, unstructured) prominence of 08.Jul.00. As one can see, the prominence does not reach its peak values before 40" above the limb and than stays on a high level. A region between 50" and 70" above the limb was selected here to calculate average line profiles.
To calculate the relative increases, all exposures taken in a certain spectral window for the prominence days were averaged (13 exposures of 120 s each for the 932 Å window, 24 exposures for the 1080 Å window, 12 exposures for the 1247 Å window, 12 exposures for the 1267 Å window, 24 exposures for the 1318 Å window, and 12 exposures for the 1560 Å window). In the reference case, only a selected number of exposures were taken into consideration, to avoid the passage of spicules and loop structures. For the relative intensity increase of each observed line, the 20" region within the prominences as described above was integrated.
To study the prominence line profiles, on the other hand, only one exposure was used, to avoid line broadening artifacts. The exposures were selected to be close to the times of ground-based studies:
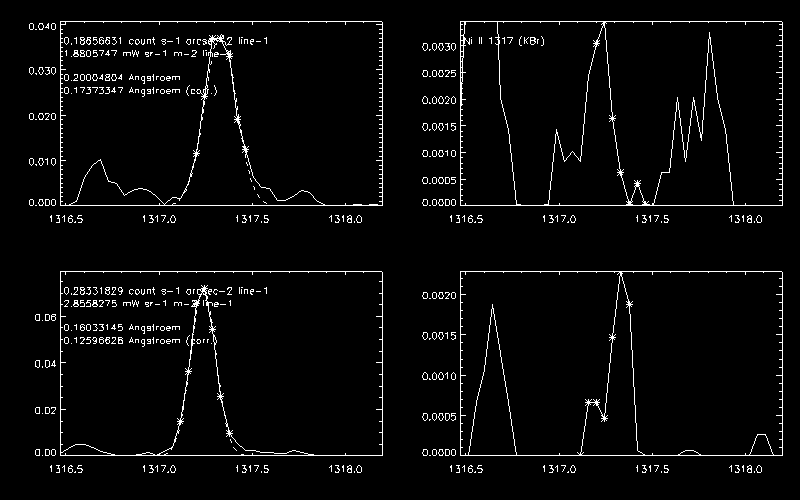
The next figure shows the raw data (solid line) and the Gaussian fit (dotted line); upper half, the situation of 04.Jul.00 (and the corresponding interval of 10.Jul.00 for reasons of comparison); lower half, the situation of 08.Jul.00. The continuum level was calculated and removed earlier. H I Lyman lines with self-absorption were only fitted at their non-absorbed wings (cf. "Results III"). The text within the images states:

Values for all selected lines and continua are in the Line Table of Results.
Almost all of the line widths are narrower in the prominence of 08.Jul.00, as compared to 04.Jul.00.
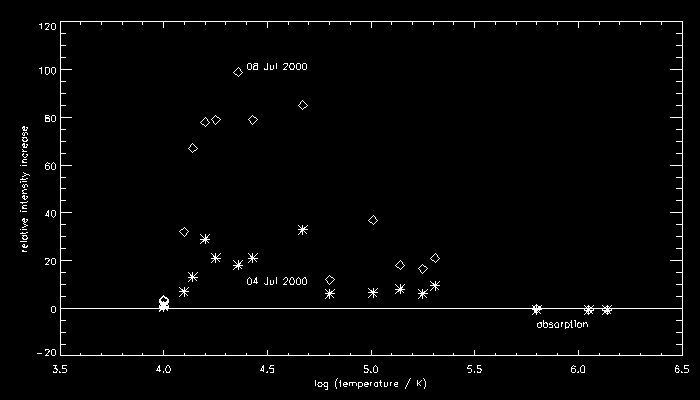
The intensity increasing effect of the prominences can be measured from 10 000 K (S I, N I, C I) to 200 000 K (S VI). Coronal lines show absorption caused by the prominence, in second order also caused by Hydrogen above the limb. Second order transition region lines (S IV, S V, O IV) show enhancement and absorption at the same time, with individual net effects. The highest relative intensity increases are measured between the H I Lyman lines and the He II lines, i.e. approximately between 15 000 K and 50 000 K, in both prominences (cf. figure below, significant values are averaged within temperature groups).

IED, 30.Nov.01