Comprehensive magneto-convection simulations including the solar photosphere
Subphotospheric structures
Dynamics of the Sun's large-scale magnetic field
Stellar magnetism
Past projects
Comprehensive magneto-convection simulations including the solar photosphere
Quiet-Sun magnetic fields
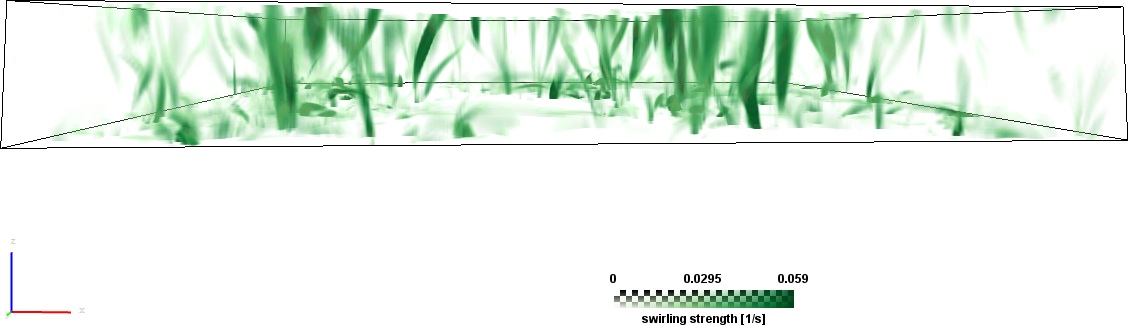
Dynamics of vortex flows and accompanying MHD wave modes in the lower solar atmosphere.
N. Yadav, R. Cameron
Magnetic fields are generated in the turbulent solar interior, cross the photosphere
and extending into the solar atmosphere where they become space filling. Observations
indicate that the vortices couple the solar interior with the atmosphere, carrying energy
from the solar interior to the outer atmosphere.
We use MURaM simuations of radiative magnetoconvection extending across the photosphere
and identify vortices using an eigenanalysis of the velocity gradient tensor. We find
rapidly swirling features which are sites of local heating. These swirling structures extend
upwards from the photosphere into the outer atmosphere. We also find that although the
velocity streamlines are showing swirling structures, the associated test particle pathlines
are more consistent with wave-like motion.
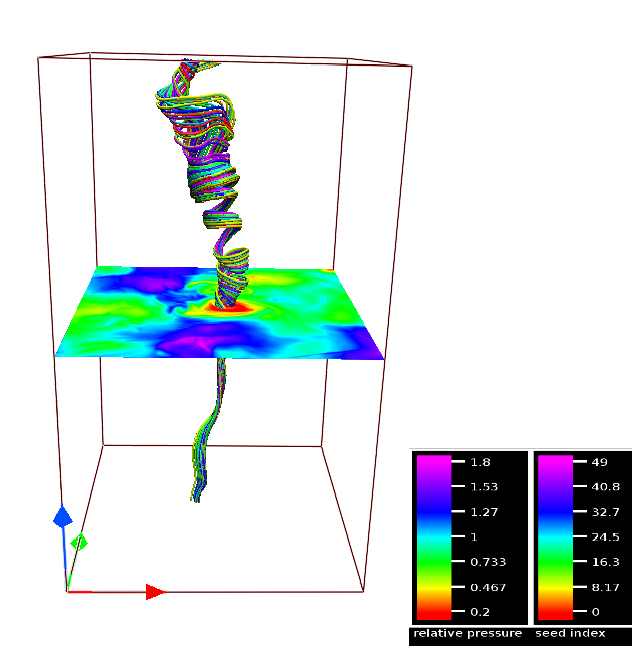
Snapshot of velocity streamlines for a vortex displaying relatively low pressure on vortex site.
Quiet-Sun magnetic fields
Observations and modelling of Poynting flux through the solar photosphere
P. Chitta, R. Cameron
The transport of magnetic energy generated by convective motions through the photosphere into the solar atmosphere is believed to heat the solar and stellar coronae to several million degrees. We combine state-of-the-art numerical simulations and the available highest spatial resolution observations (~ 75 km) to understand the magneto-convective processes and their observable signatures. For numerical simulations we use MURaM, a 3D MHD code that provides realistic simulations of the solar magneto-convection in the photosphere. For observations we use data obtained from the two flights of Sunrise, and GREGOR telescope among other space and ground based telescopes.
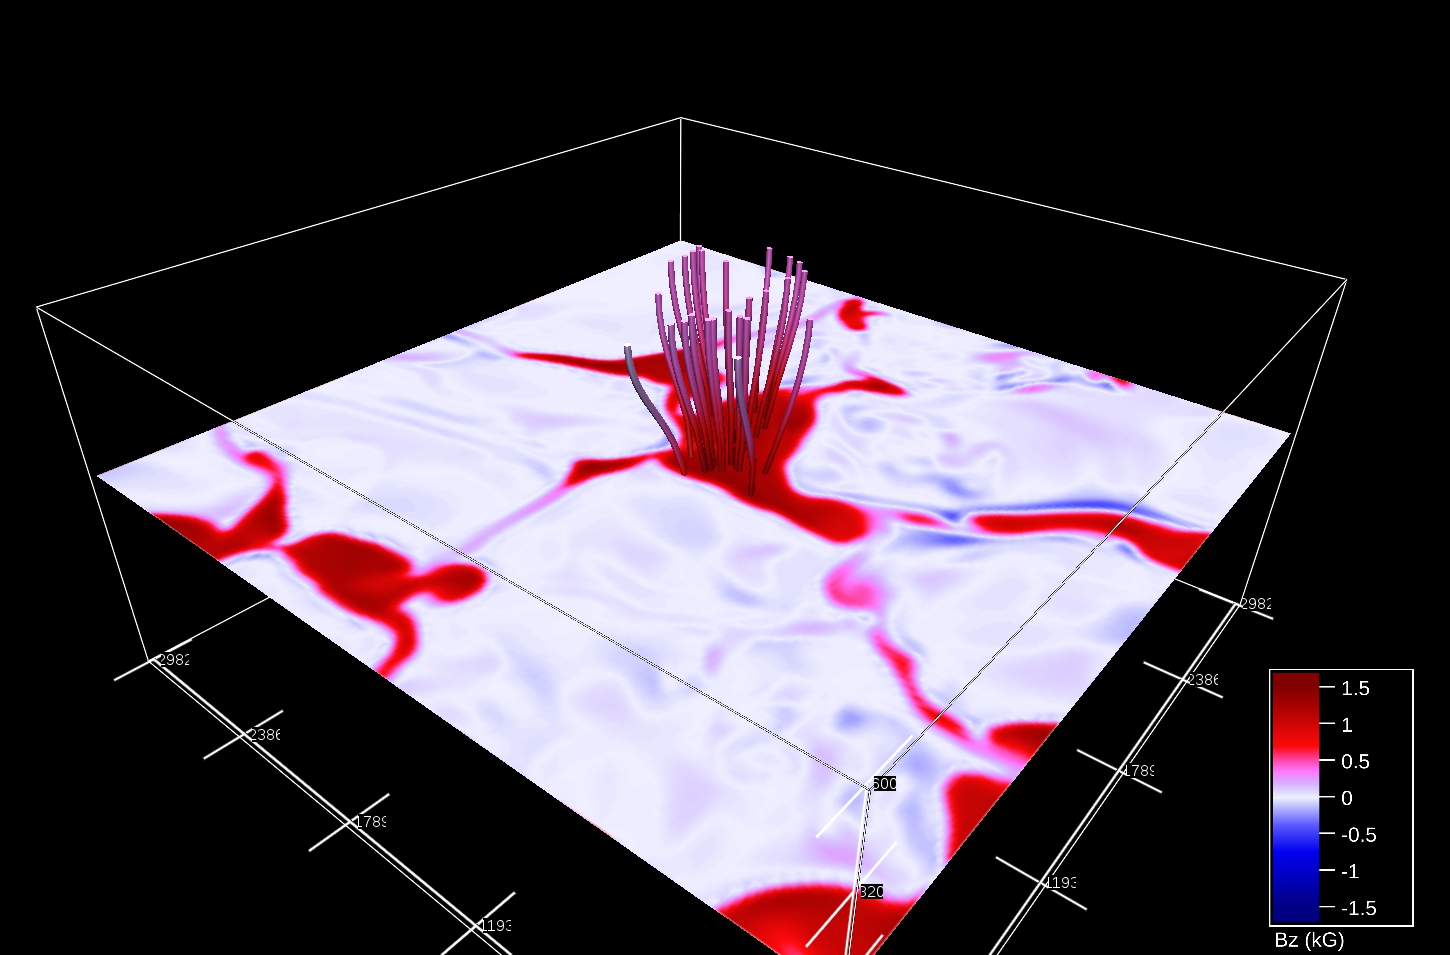
The figure shows simulated magnetic field at photospheric height. The solid lines are magnetic field lines that expand into the solar atmosphere. Studying how these field lines are advected due to turbulent convection will give us a handle on the Poynting flux through the solar atmosphere.
Quiet-Sun magnetic fields
Small-scale dynamo action
A. Vögler, M. Schüssler, R. Moll, J. Pietarila Graham,
R.Cameron, S. Danilovic
Various observations indicate the existence of significant amounts of
magnetic flux ubiquitous in the `quiet Sun', i.e., outside active
regions, with mixed polarity on small scales. Since idealized Boussinesq
closed-box simulations of Cattaneo (ApJ, 1999) showed dynamo action of
non-helical instationary convection, the existence of a similar process
based upon granular convection of the Sun has been discussed. Removing
the idealizations in a realistic simulation with the MURaM code, we have
found that solar surface convection seems indeed capable of supporting a
dynamo process: for sufficiently large magnetic Reynolds number, the
magnetic energy of an initial weak seed field grows exponentially and
saturates at levels consistent with the observational inferences.
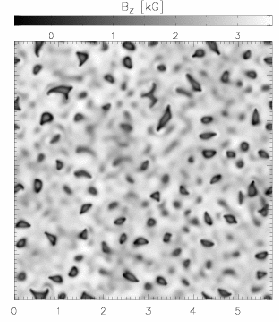
The generated surface field has a small/scale structure with mixed polarity
(right panel: vertical field image near optical unity; the size of the
magnified inset is about 1200 km x 1200 km on the Sun) and shows an
association with the intergranular downflow lanes.
Spectral transfer analysis of the MURaM dynamo rules out the tangling
of magnetic field lines (turbulent cascade) and Alfvénization
of turbulent velocity fluctuations ("turbulent induction") as sources
of small-scale magnetic field (see figure below). Rather, small-scale
fluid motions stretch small-scale magnetic field to produce more
small-scale magnetic field and the scales involved become smaller with
increasing Reynolds number. This is a small-scale turbulent dynamo.
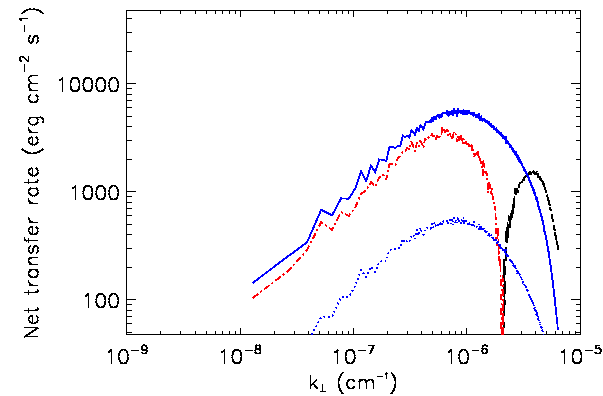
Rate of magnetic energy production by
stretching (blue solid) and compression (blue dotted), magnetic energy
lost (red) and gained (black) from the turbulent cascade versus
horizontal spatial frequency. Magnetic field is produced predominantly
at scales near 65 km from stretching motions.
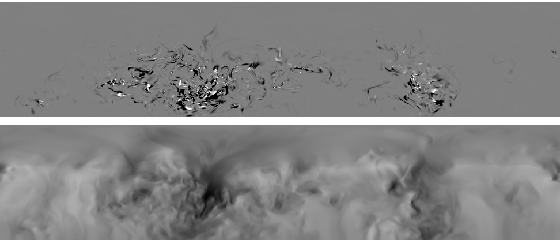
Vertical cuts of the vertical component of the magnetic field (top),
and vertical velocity (bottom) from a dynamo simulation. The magnetic field
is concentrated in the turbulent down flow lanes.
The basic dynamo mechanism was found to be a universal property
of magnetic fields and turbulent morions, with the same process operating
in homogeneous turbulence, convectively driven turbulence and in our
comprehensive photospheric simulations.
Reference
A solar surface dynamo, Vögler, A.; Schüssler, M., Astron. Astrophys., 465, L43-L46 (2007).
Turbulent small-scale dynamo action in solar surface simulations, J. Pietarila Graham, R. Cameron, M. Schüssler, ApJ, Vol. 714, pp. 1606-1616, 2010
Universality of the Small-Scall Dynamo Mechanics , R. Moll, J. Pietarila Graham, J. Pratt, R. H. Cameron, W.-C. Müller, M. Schüssler, ApJ, Vol. 736, article id. A36, 2011
Turbulent solar magnetic fields
J. Pietarila Graham, S. Danilovic, M. Schüssler
Observations of small-scale magnetic fields fields from Hinode
and numerical simulations of dynamo action in the photospheric layers
of the Sun are compared. Using turbulence theory to motivate
self-similar scaling laws, a lower bound of 50G is derived for the
unsigned quiet-Sun vertical flux. This agrees with our MURaM
simulation-based estimate and (considering vector magnitudes) resolves
the discrepancy between Hanle and Zeeman observations.
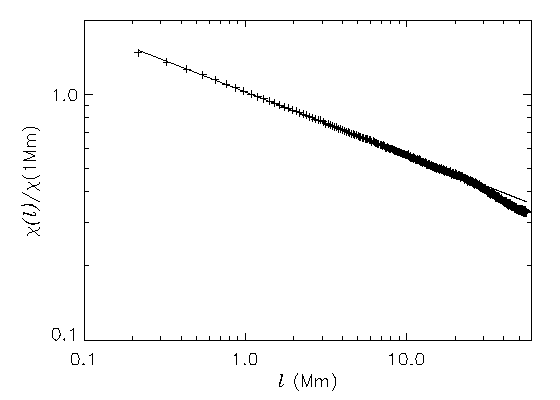
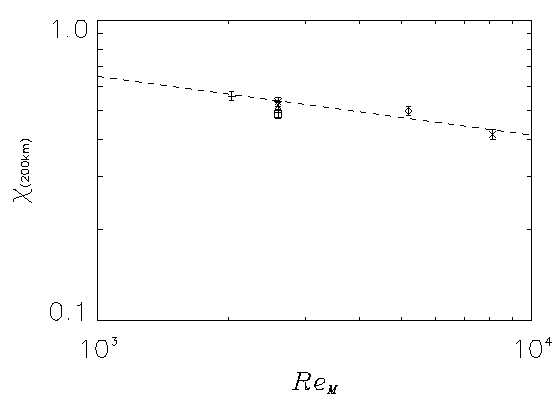
Top: Portion of magnetic flux remaining after averaging
over boxes of increasing size (from Hinode observation). A
self-similar power-law is abundantly clear for 2 decades of length
scales down to the resolution limit. Bottom: Flux remaining after
averaging over 200 km X 200 km boxes for MURaM as a function of
magnetic Reynolds number, ReM. Extrapolation to solar
ReM indicates at least 80% cancellation at 200 km
resolution.
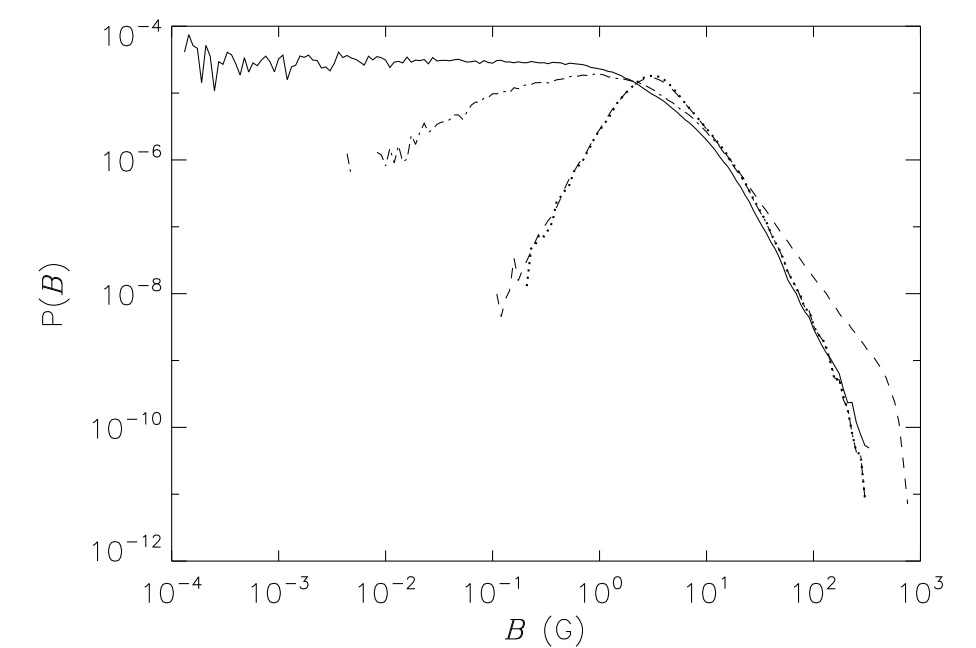
Probability distribution functions of magnetic field
strengths from the simulations (solid line), from the Hinode
observations (dashed lines), the inversions of synthetic
stokes-diagnostics created from the simulations (dash dot) and when an
observational noise level of 0.0011 is added (dotted line). The
observational peak that was previously considered solar is seen to be
solely due to noise.
References
Turbulent Magnetic Fields in the Quiet Sun: Implications of Hinode Observations and Small-Scale Dynamo
Simulations, Pietarila Graham, J., Danilovic, S., Schüssler, M., ApJ, Volume 693, 1728-1735 (2009).
Understanding the observed brightness of magnetic elements
D. Röhrbein, S. Danilovic, R. H. Cameron, M. Schüssler
One use of comprehensive photospheric simulations is to better understand observations. In
this work we have focussed on trying to understand the observed intensity flux relationship
which shows that beyond a certain level the intensity of points associated with high magnetic
field strengths begins to fall even when pores and sunspots are excluded. We found that the
observed relationship could be explained by the limited resolving power of available telescopes.
The prediction is that as higher resolution telescopes become available a monotonic increase
in intensity with field strength will be found outside of sunspots/pores.
Is there a non-monotonic relation between photospheric brightness and magnetic field strength in solar plage regions? , D. Röhrbein, R. H. Cameron, M. Schüssler, A & A, Vol. 532, id. A140, 2011
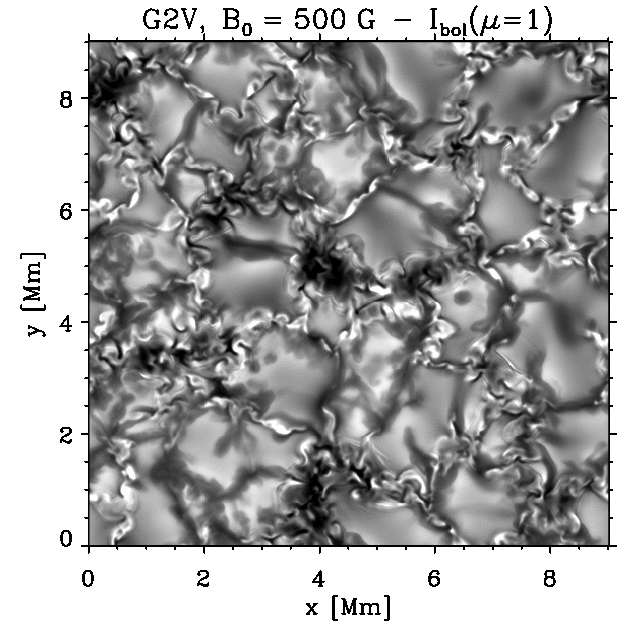
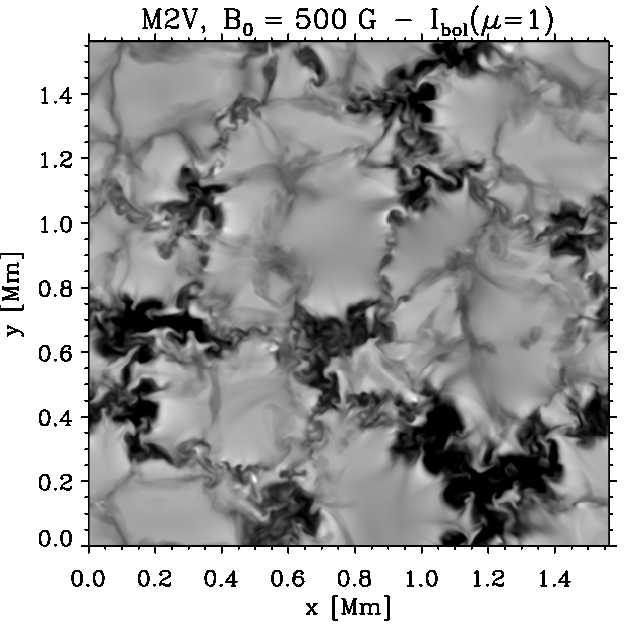
Vortices in the solar atmosphere
R. Moll, R. H. Cameron, M. Schüssler
Where the magnetic field is weak, the upper photosphere is dominated by
acoustic shocks. As the magnetic field increases the shocks are supressed
and field-aligned vortices become dominant. Similar to the shocks, they
heat the plasma and provide a possible chanel for transporting energy
into the overlying chromosphere.
Vortices in a weak plage simulation are aligned with the magnetic field
which couple the different layers of the atmosphere.
References
Vortices in simulations of solar surface convection , R. Moll, R. H. Cameron, M. Schüssler, A & A, Vol. 533, id. A126, 2011
Vortices, shocks, and heting in the solar atmosphere: effect of a magnetic field , R. Moll, R. H. Cameron, M. Schüssler, A & A, Vol. 541, id. A68, 2012
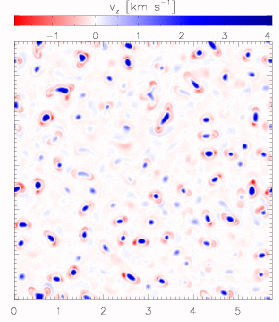
Sunspots
The umbra
M. Schüssler, A. Vögler (Univ. of Utrecht)
The strong magnetic field (from 2000 G to more than 4000 G) in a sunspot
umbra suppresses the normal granular convection. Simulations with the
MURaM code have shown that the convective energy transport instead
occurs in the form of narrow hot upflow plumes, which appear as bright
patches before a dark background (see brightness image to the left,
spatial scale in Mm). Their sizes, contrasts and lifetimes are similar
to the observed properties of so-called `umbral dots'.
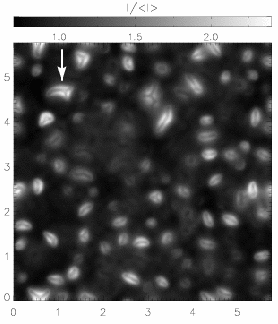
The left panel shows the brightness, with the units on the axes
being in Mm.
The vertical velocity image (middle panel) taken near the level of
optical depth unity shows that the upflows in the plumes (blue) are
surrounded by narrow downflow channels (red). The strong expansion of
the upflow plumes with height due to the pressure stratification leads
to a strong expansion of the plumes and a concomitant reduction of the
magnetic field strength (right panel) in the upper layers. Near optical
depth unity, the hot material in the plume loses its buoyancy and piles
up in a cusp-shaped structure, leading to the appearance of dark lanes
in the brightness image.
Reference
Magnetoconvection in a Sunspot
Umbra, Schüssler, M. & Vögler, V., ApJ, Volume 641,
Issue 1, pp. L73-L76 (2006).
The penumbra
M. Rempel, M. Schüssler, M. Knolker, R. H. Cameron
Using comprehensive simuilations of the solar photosphere, the nature of the
penumbra has been studied. Essentially the penumbra is the preferred form of convection
in a strong, inclined magnetic field.
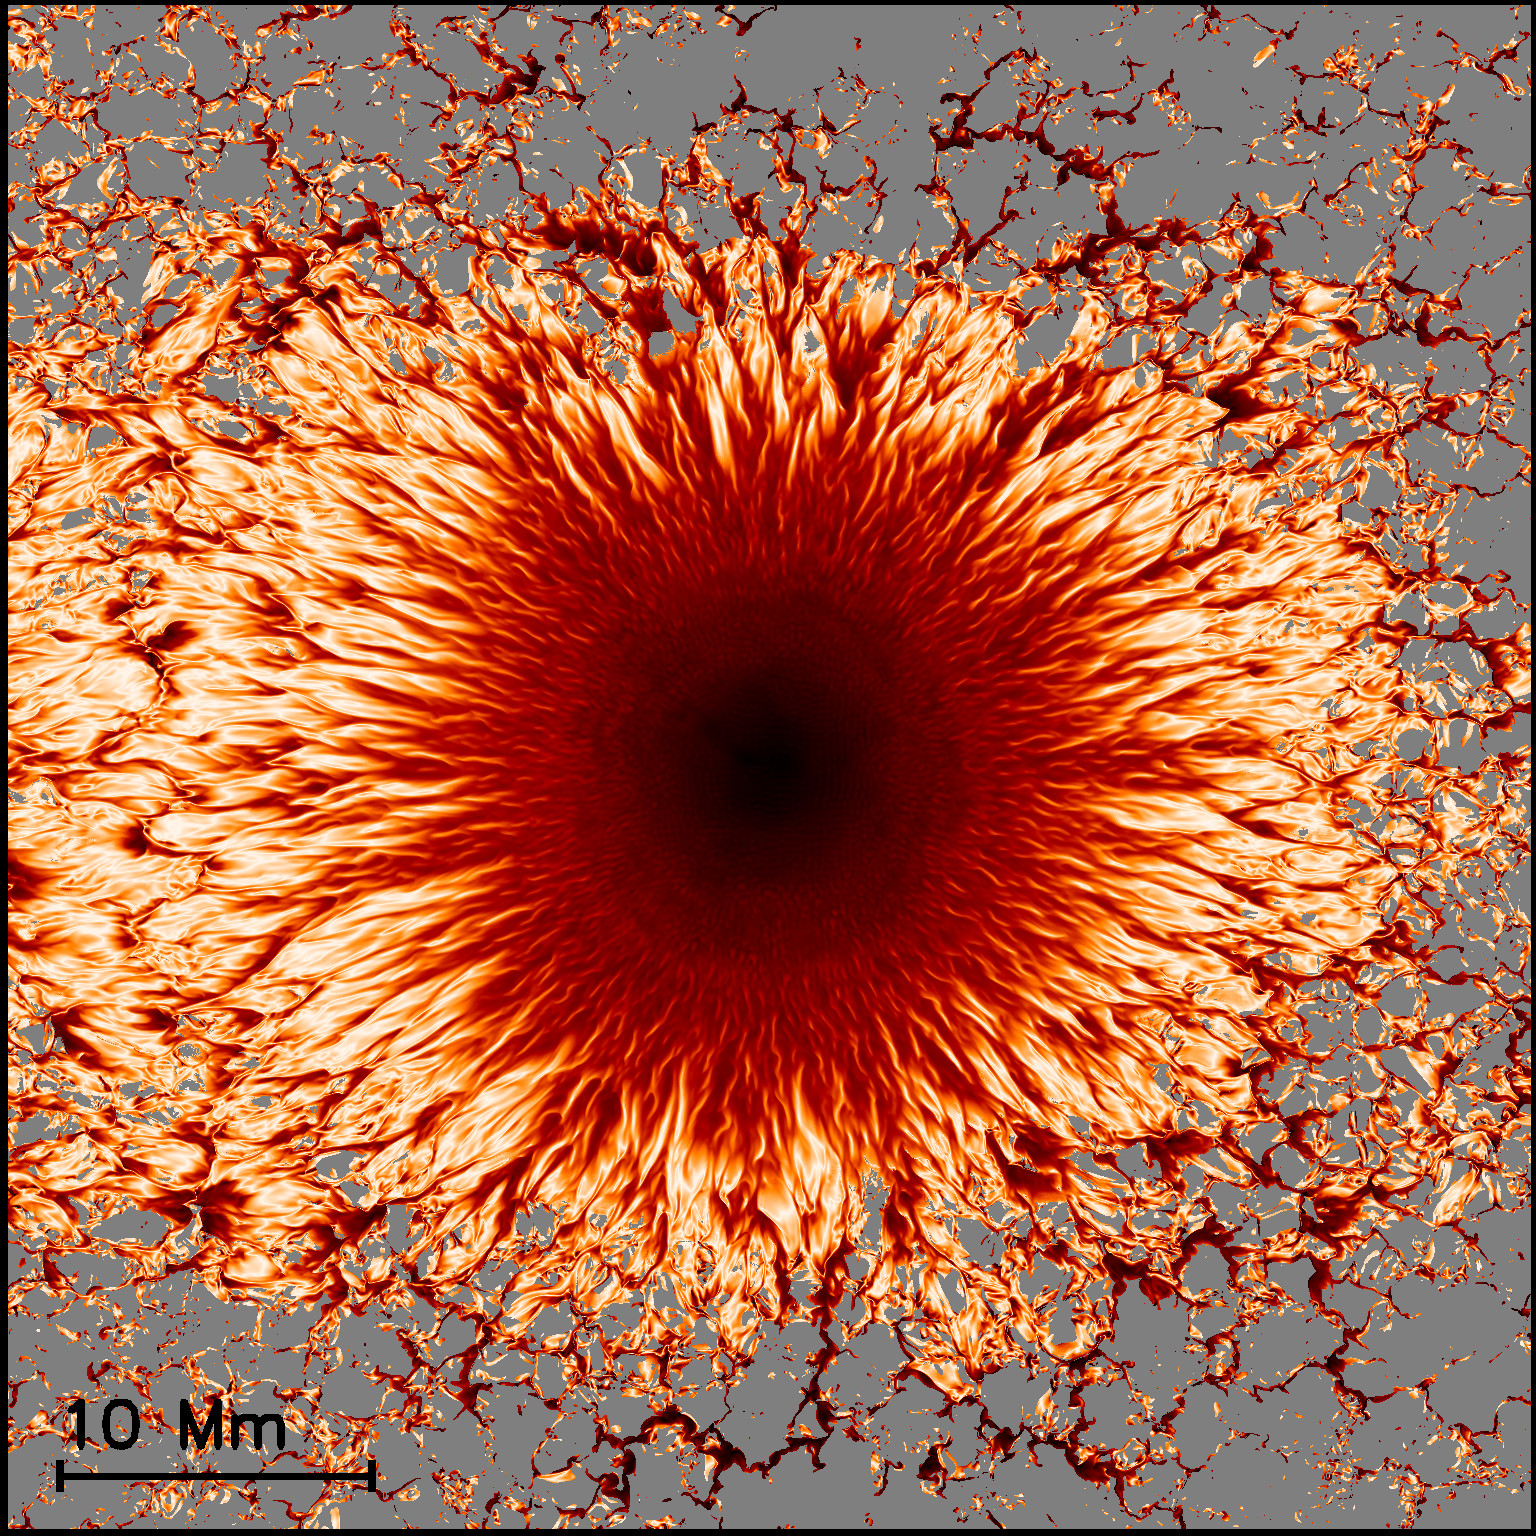
Visualization of the structure of a fully 3d sunspot studied using comprehensive
radiative magnetoconvection simulations.
Reference
Radiative Magnetohydrodynamic Simulation of Sunspot Structure, M. Rempel, M. Schüssler, M. Knölker, ApJ, Vol. 691, pp. 640-649, 2008
Penumbral Structure and Outflows in Simulated Sunspots, M. Rempel, M. Schüssler, R. Cameron, M. Knölker, Science, Vol. 325, pp. 171-174, 2009
Active Regions
M. Cheung (LMSAL, Palo Alto), M Schüssler, F. Moreno-Insertis (IAC, Tenerife/Spain)
Magnetic fields exist over a wide range of length- and time-scales on
the solar photosphere. We investigate the flux emergence process by
carrying out realistic simulations of emerging flux tubes in the
photosphere with the MURaM code. Since the effects of radiative transfer
is included in our MURaM code, we are able to compare our simulation
results with real photospheric observations of magnetic flux
emergence.
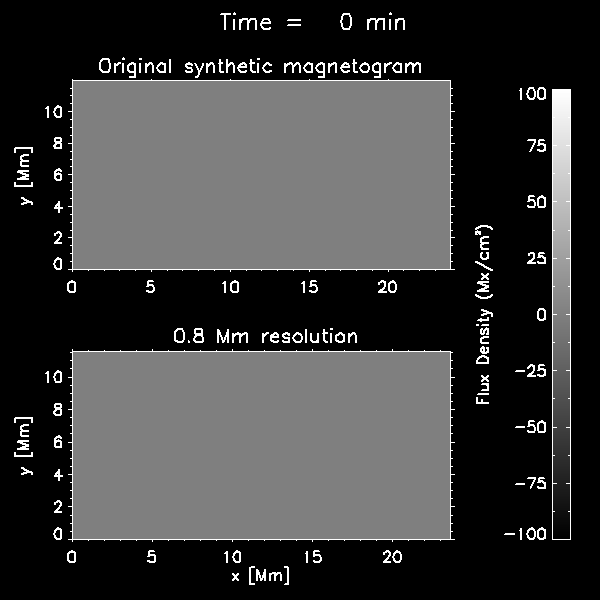
The picture on the left shows a transient dark lane marking
the site of flux emergence. The properties of this dark lane are
different from those of normal granulation. The animation to the right
shows a synthetic greyscale `magnetogram' (white and black indicating
the two opposite magnetic polarities) from the simulated emergence of a
magnetic loop. The upper panel gives the original resolution of the
simulation while the lower panel results after smearing with a Gaussian
to be comparable with a typical ground-based observational result.
References
Solar Surface Emerging Flux Regions: A Comparative Study of Radiative MHD Modeling and Hinode SOT Observations, M. Cheung, M. Schüssler, T. D. Tarbell, A. M. Title, ApJ, Vol. 687, pp. 1373-1387, 2008
Magnetic flux emergence in granular convection: radiative MHD simulations and observational signatures, Cheung, M. C. M.; Schüssler, M.; Moreno-Insertis, F., Astron. Astrophys., 467, 703-719 (2007).
MURaM website
Subphotospheric structures
Subsurface structure of sunspots
R. Cameron, H. Schunker, A. Pietarila, L. Gizon
We have investigated the way in which waves propagating inside the
Sun are affected by the presence of a sunspot. Our simulations nicely
reproduce the observed helioseismic signature and indicate that
most of the seismic signature is coming from the surface perturbation
caused by the sunspot.
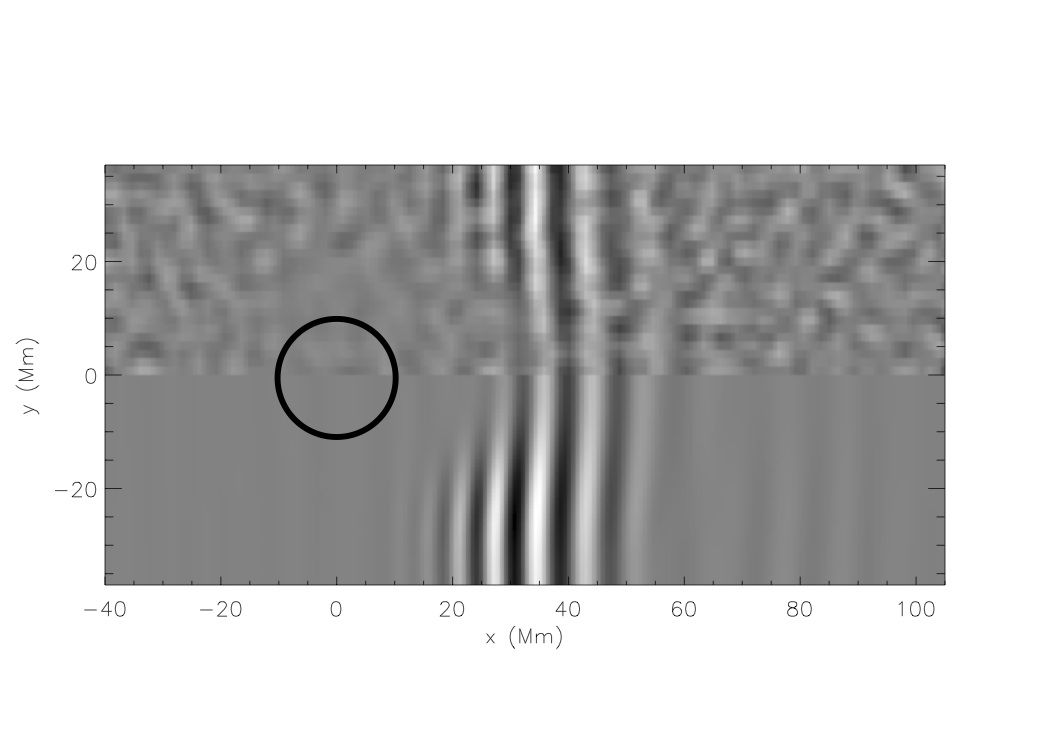
Shown is an f-mode (suface gravity) after it has propagated
trought a sunspot. The sunspot is centred at the origin and the
waves are propagating from left to right. The lower half of the
image shows the result of the calculation, the top half is the
result from helioseismological measurements.
Reference
Constructing Semi-Empirical Sunspot Models for Helioseismology Modeling the Subsurface Structure of Sunspots , R. H. Cameron, L. Gizon, H. Schunker, A. Pietarila, Solar Phys., Vol. 268, pp. 293-308, 2011
Helioseismology of sunspots: confronting observations with three-dimensional MHD simulations of wave propagation, R. Cameron, L. Gizon, T. L. Duvall, Solar Phys., Vol 251, pp. 291-308, 2008
Dynamics of the Sun's large-scale magnetic field
The generation of toroidal field and the Babcock-Leighton dynamo
R. Cameron, M. Schüssler
We have applied Stokes theorem, combined with Hales law, to show that the large-scale toroidal
field which produces sunspots is produced by the Babcock-Leighton dynamo mechanism.
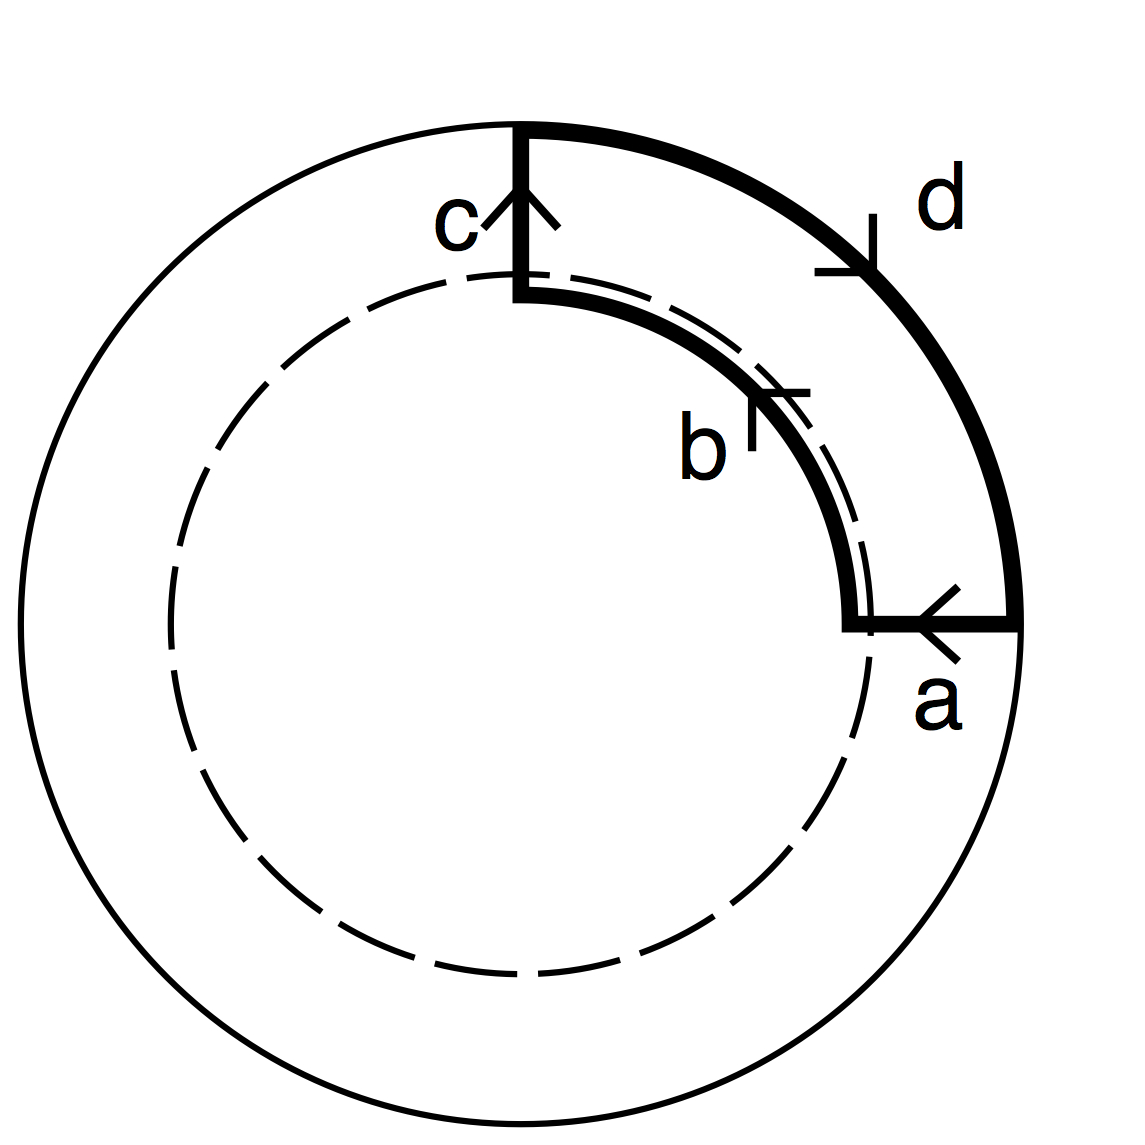
Shown is the contour used in determining the generation of toroidal field in each hemisphere
using Stokes theorem.
References
The crucial role of surface magnetic fields for the solar dynamo,
R. Cameron, M. Schüssler, Science, Vol. 347, 1333, 2015
From the photosphere to the heliosphere
Baumann, I., J. Jiang, R. Cameron, D.Schmitt, M. Schüssler
We aim to model the heliospheric magnetic field, especially near the earth,
using the historical sunspot record. This will allow us to reconstruct the
heliospheric field back to the end of the Maunder minimum. The sunspot
record is used as input data, and is evolved using the Surface
Flux Transport model. The heliospheric field is then obtained using
the Current Sheet Source Surface model.
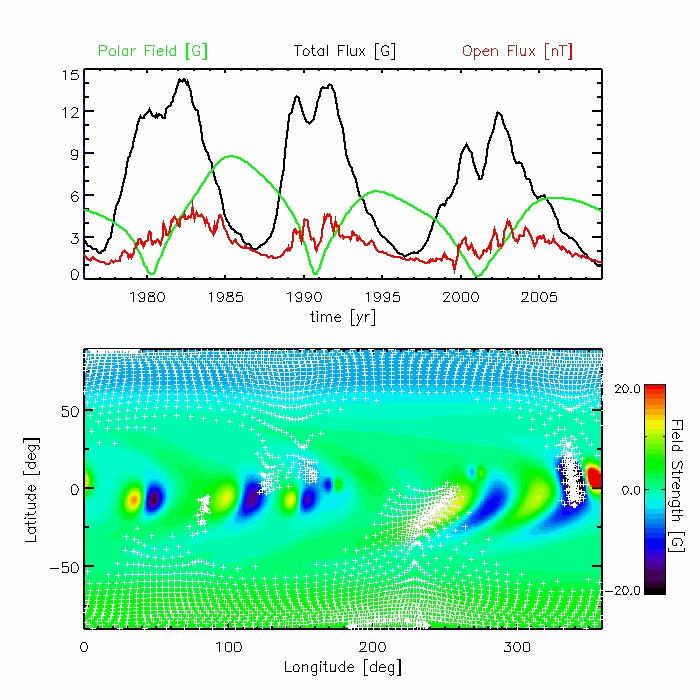
Upper panel: The temporal evolution of polar field, solar surface total flux
density and open flux density.
Lower panel: The temporal evolution of the solar surface field distribution
from the SFT simulation and the location of the open flux.
References
Modeling the Sun's open magnetic flux and heliospheric current sheet, J. Jiang, R. H. Cameron, D. Schmitt, M. Schüssler, ApJ, Vol. 709, pp. 301-307, 2010
Modeling the Sun's open magnetic flux, Schüssler, M. & Baumann, I., Astron. Astrophys. 459, 945-953 (2006).
Magnetic flux transport on the Sun
I. Baumann, D.Schmitt, M. Schüssler, S.K. Solanki, J. Jiang, R. Cameron
Active regions emerge on the photosphere as bipolar magnetic regions in the
low-latitude sunspot-belts. The magnetic flux is dispersed by supergranular
convective motions and meridional circulation. The differential rotation rate of
the sun leads to a shearing of the flux pattern. The transport equation is
derived from the induction equation resulting from the MHD-Approximation.
We have also extended the model to include the effect of the cycle-related
inflows into the activity region belts. This makes the SFT model nonlinear and
provides an appealing explanation for the activity levels for cycles 13 to 21.
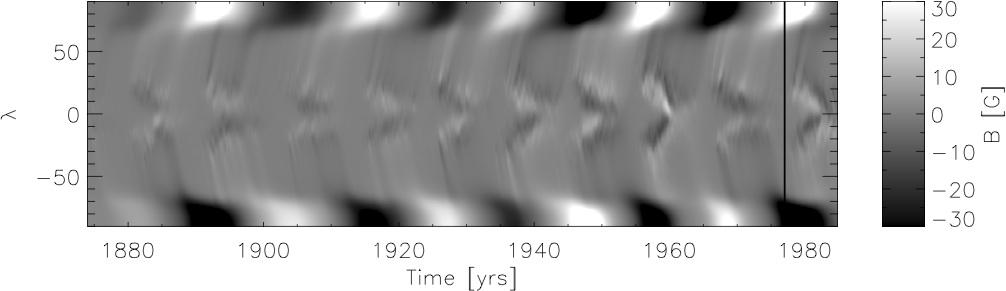
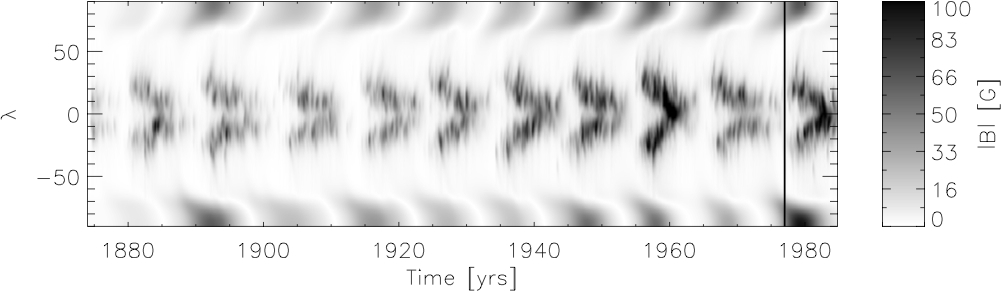
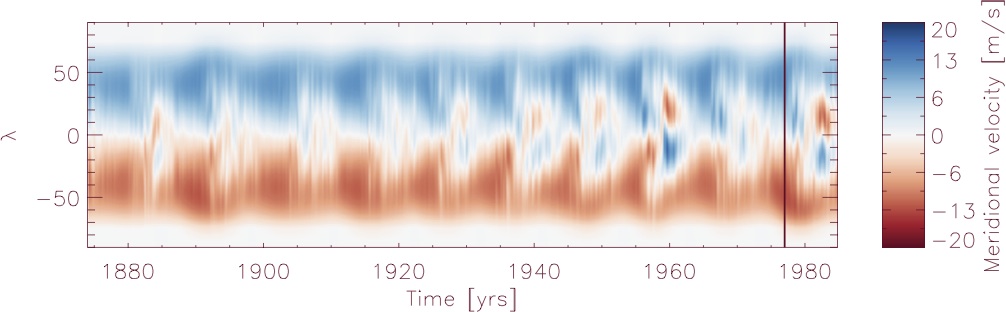
Longitude averaged latitude-time diagram of the magnetic flux
(upper panel), unsigned magnetic flux (middle panel) and meridional
flow (lower panel) from the non-linear Surface Flux Transport model.
References
Are the strength of solar cycles determined by converging flows towards the activity belts? , R. H. Cameron, M. Schüssler, A&A (accepted)
The effect of activity-related meridional flow modulation on the strength of the solar polar magnetic field, J. Jiang, E. Isik, R. H. Cameron, D. Schmitt, M. Schüssler, ApJ, Vol. 714, pp. 597-602, 2010
A necessary
extension of the surface flux transport model, Baumann, I., Schmitt, D. and
Schüssler, M., Astron. Astrophys., 446, 307-314 (2006).
Evolution of the large-scale magnetic field on the solar surface: a parameter study, I. Baumann, D. Schmitt, M. Schüssler, and S. K. Solanki, Astron. & Astrophys., 426, 1075-1091 (2004).
Flux Transport Dynamo modelling
D.Schmitt, J. Jiang, E. Isik, R. Cameron
We have began using the Flux Transport Dynamo framework to
extend the results we have obtained using the SFT model to
study the evolution of the field beneath the photosphere.
Our results have in particular shown that reasonably strong
magnetic pumping is required to match the (surface) observations.
Poloidal field lines and toroidal field (blue/red) for cycle 19
froma FTD simulation including magnetic pumping and cycle-depenedent
sunspot group tilt angles..
Surface flux evolution constraints for flux transport dynamo , R. H. Cameron, D. Schmitt, J. Jiang, E. Isik, A & A, Vol. 542, id. A127, 2012
Stellar magnetism
Comprehensive simulations of stellar photospheres
B. Beeck, R. H. Cameron, M. Schüssler, A. Reiners (Univ. Göttingen)
We set up a series of six local-box simulations of cool main-sequence stars (6900 K ≥ Teff ≥ 3680 K). For each set of stellar parameters, we have run one non-magnetic as well as three magnetic simulations with an imposed vertical magnetic field strength of 20 G, 100 G, and 500 G. For the non-magnetic simulations, we analysed the overall stratification, the granule sizes and life times as well as the impact of the convective flows on the limb darkening and on shapes of synthesised spectral line profiles (Beeck et al., 2013a, 2013b)
F3V
(Teff = 6890 K, log g [cgs] = 4.301) | G2V
(Teff = 5760 K, log g [cgs] = 4.438) |
 |  |
| | |
K5V
(Teff = 4370 K, log g [cgs] = 4.699) | M2V
(Teff = 3690 K, log g [cgs] = 4.826) |
 |  |
| Snapshots of the vertical bolometric intensity four non-magnetic stellar simulations. In all images the grey scale saturates at ± 2 σ, i. e. twice the standard deviation of the intensity. Note the significant difference of the length scale of the granules. |
The magnetic simulations revealed that the structure of small-scale magnetic flux concentrations substantially differs between solar-type and M-type stars. In Sun-like stars, small concentrations of magnetic flux in simulations with an average vertical field strength of up to 500 G mostly correspond to structures of enhanced intensity whereas, on M-type stars, these structures are mostly darker than the non-magnetic environment (Beeck et al., 2011). This different appearance is caused by the different radius-to-depth ratio of the optical surface depression caused by the magnetic flux tubes. In the Sun, the efficient convective collapse of thin flux tubes produces strongly evacuated structures with a low radius-to-depth ratio, which can be efficiently heated radiatively from the sidewalls. On M dwarfs the convective collapse is less efficient leading to much shallower depressions in the optical surface, with little radiative heating from their (small) walls (Beeck et al., 2015a).
| Comparison of the vertical bolometric intensity of snapshots from the G2V (=solar) and the M2V simulations both with an average vertical field of 500 G. The grey scale saturates at ± 2.5 σ, i. e. 2.5 times the standard deviation of the intensity. In the solar case, most of the magnetic flux concentrations appear bright (only the largest are dark), all flux concentrations on the M-star simulation have a significantly lower intensity than the unmagnetised parts of the surface. |
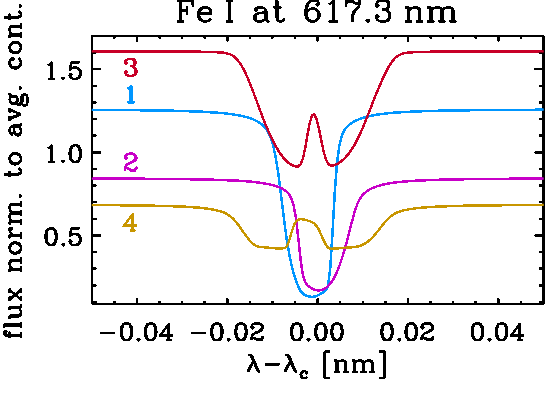
The impact of the magnetic field on the atmospheric structure leads to a strong correlation of velocity field, magnetic field and the radiation field, which leaves imprints in spectral line profiles. For some representative line profiles synthetic, line profiles were calculated. In many cases the line broadening by virtue of the Zeeman effect is opposed by a magnetically induced line weakening, which is caused by a strong reduction of the line opacities in magnetic small-scale structures (Beeck et al., 2015b). As these spectral lines are used for the detection and measurement of stellar magnetic fields, it is necessary to take effects like this into account in the interpretation of observations.
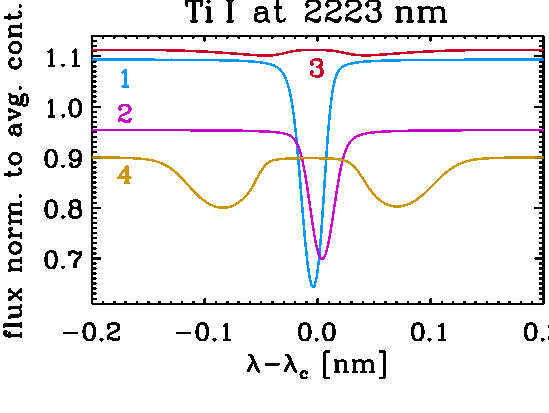
| Local vertical spectral line profiles for four points in a snapshot of the K0V-star simulation with 500 G average vertical field-strength. Points 1 and 2 are in an unmagnetised upflow and downflow, respectively. The height dependence of the velocity leads to asymmetries in the line profile. Points 3 and 4 are in a bright and dark magnetic structure respectively. By virtue of the Zeeman effect both spectral lines are split, however, due to the strongly modified thermodynamical structure, the opacity of the lines is also changed: the Fe line is weakened in the dark structure while the Ti line is weakened in the bright structure. The severe weakening of the Ti line is mostly due to ionisation of Ti I in the hot (bright) magnetic structure and will lead to a strong underestimation of the magnetic field from the disc-integrated spectral line profile (if a substantial fraction of the field is distriubuted over the stellar surface in form of small bright magnetic features). |
References
- Three-dimensional simulations of near-surface convection in main-sequence stars. IV. Effect of small-scale magnetic flux concentrations on centre-to-limb variation and spectral lines, B. Beeck, M. Schüssler, R. H. Cameron, A. Reiners, accepted for publication in A&A, 2015
- Three-dimensional simulations of near-surface convection in main-sequence stars. III. The structure of small-scale magnetic flux concentrations, B. Beeck, M. Schüssler, R. H. Cameron, A. Reiners, accepted for publication in A&A, 2015 → additional online material (animations)
- MHD Simulations of Near-Surface Convection in Cool Main-Sequence Stars, B. Beeck, M. Schüssler, A. Reiners, Cool Stars 18 Proceedings, 2015
- Three-dimensional simulations of near-surface convection in main-sequence stars. II. Properties of granulation and spectral lines, B. Beeck, R. H. Cameron, A. Reiners, M. Schüssler, A&A, Vol. 558, A49, 2013
- Three-dimensional simulations of near-surface convection in main-sequence stars. I. Overall structure, B. Beeck, R. H. Cameron, A. Reiners, M. Schüssler, A&A, Vol. 558, A48, 2013
- MHD Simulations Reveal Crucial Differences Between Solar and Very Cool Star Magnetic Structures, B. Beeck, M. Schüssler, A. Reiners, ASP Conf. Ser., Vol. 448, A48, p.1071, 2011
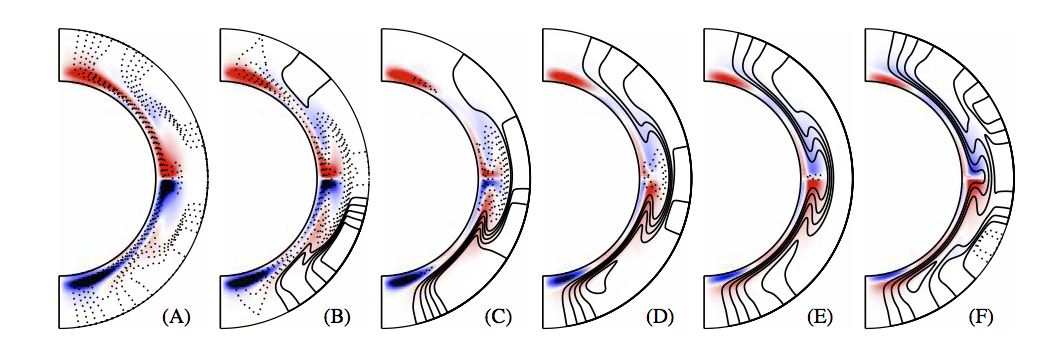
Coupled models of generation, emergence, and surface evolution of stellar magnetic flux
E. Isik, D. Schmitt, M. Schüssler
We develop a model which connects the missing link
between deep-seated dynamos and the evolving surface flux in cool stars.
The link, which is hitherto not included in any dynamo model,
is the buoyant rise of magnetic flux tubes
from the dynamo layer throughout the entire convection zone.
We choose toroidal flux tubes with a spatial probability distribution
determined by the mean toroidal magnetic field generated by a cyclic dynamo.
As a first example, we use a thin-layer
alpha-omega dynamo (Schüssler & Schmitt 1989) with Sun-like shear
in the convective overshoot region. We carry out numerical
simulations of the rise of Parker-unstable flux tubes (Caligari et al. 1995),
which in turn determine the latitudes
and the tilt angles of the emerging flux loops. This information is then
put into a surface flux transport model (Baumann et al. 2004, 2006) with
Sun-like differential rotation, meridional flow, and turbulent supergranular
diffusion. In this part, we simulate the evolution of bipolar magnetic
regions, which emerge with a Sun-like area distribution and with tilt angles
and emergence latitudes determined by rising flux tubes.
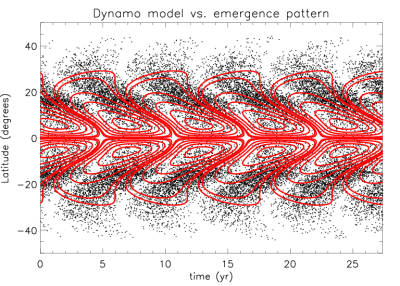
The figure on the left panel shows a comparison of the generated toroidal field pattern
in the overshoot region (contours) and the emerging flux tubes on the surface (dots),
for a star having solar internal structure but rotating 2.7 times faster than
the Sun, hence representing somewhat a "younger Sun". The time-latitude diagram
on the right-hand panel shows the surface evolution of longitudinally averaged
magnetic flux density. The polar fields are about 20-30 times stronger than in
the Sun, and the cyclic dynamo is no longer visible in the variation of
magnetic flux integrated over the entire surface.
Reference
A coupled model of magnetic flux generation and transport in stars, Isik, E.;
Schmitt, D.; Schüssler, M., Astron. Nachr., 328, 1111